
International Journal of Robotic Engineering
(ISSN: 2631-5106)
Volume 6, Issue 1
Research Article
DOI: 10.35840/2631-5106/4135

Article Formats
Effects of the Aluminum Alloy with Intermetallic a Phase on the Microstructural and Corrosion Resistance
Table of Content
Figures
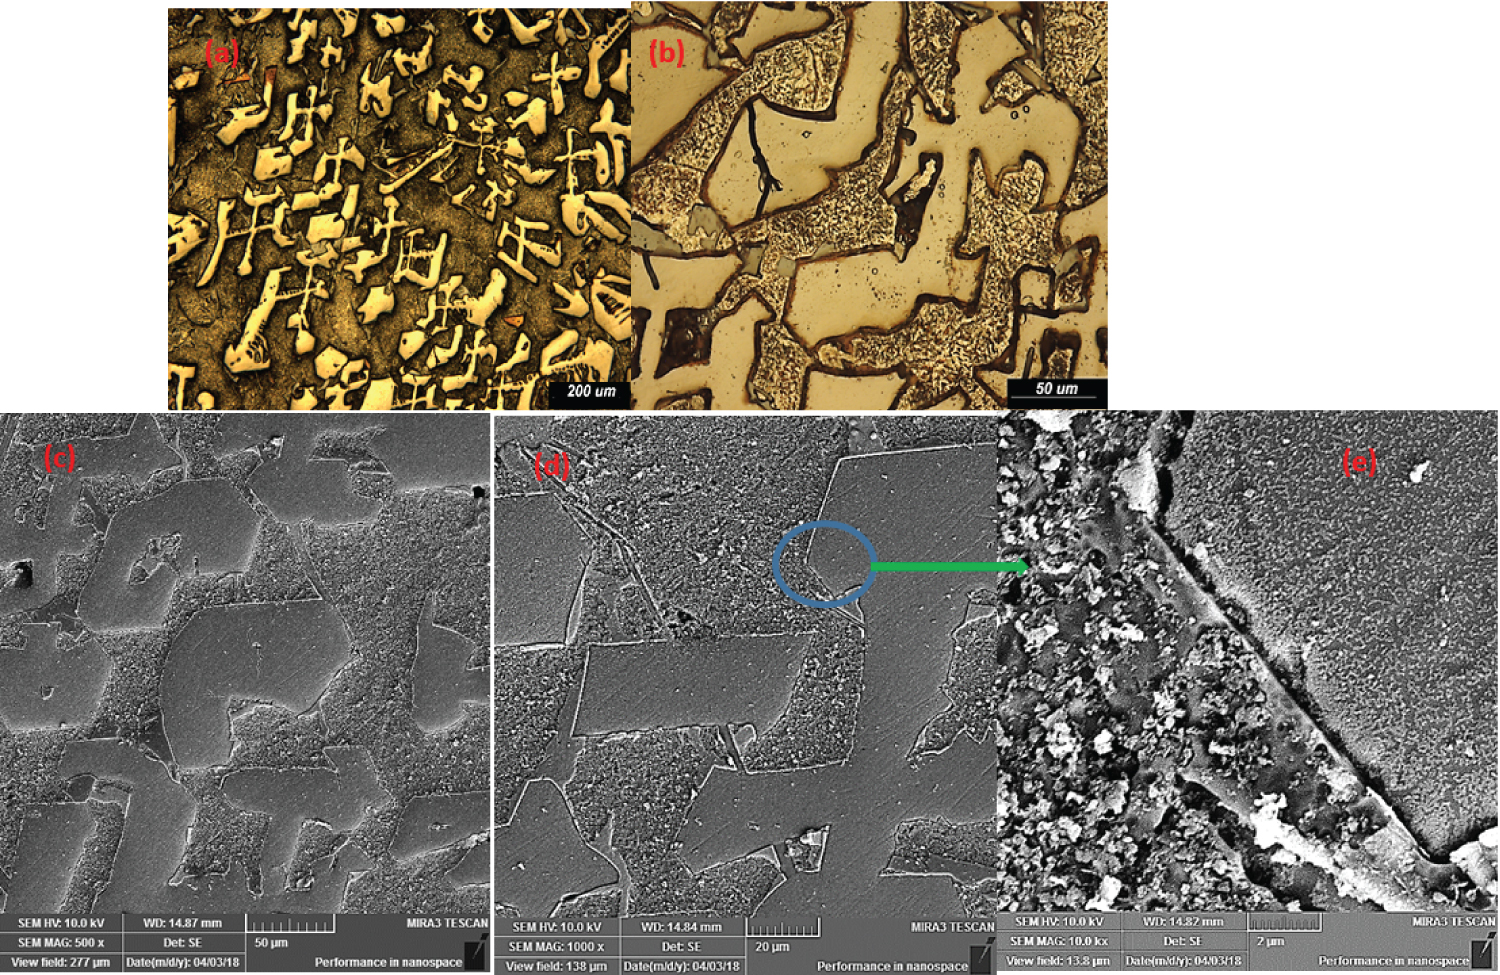
Figure 1: Microstructural analysis: a) Optical....
Microstructural analysis: a) Optical micrograph; b) Higher magnification of figure before; c) FEG/SEM imagens; d) Higher amplification of figure before; e) Image of the interphase.
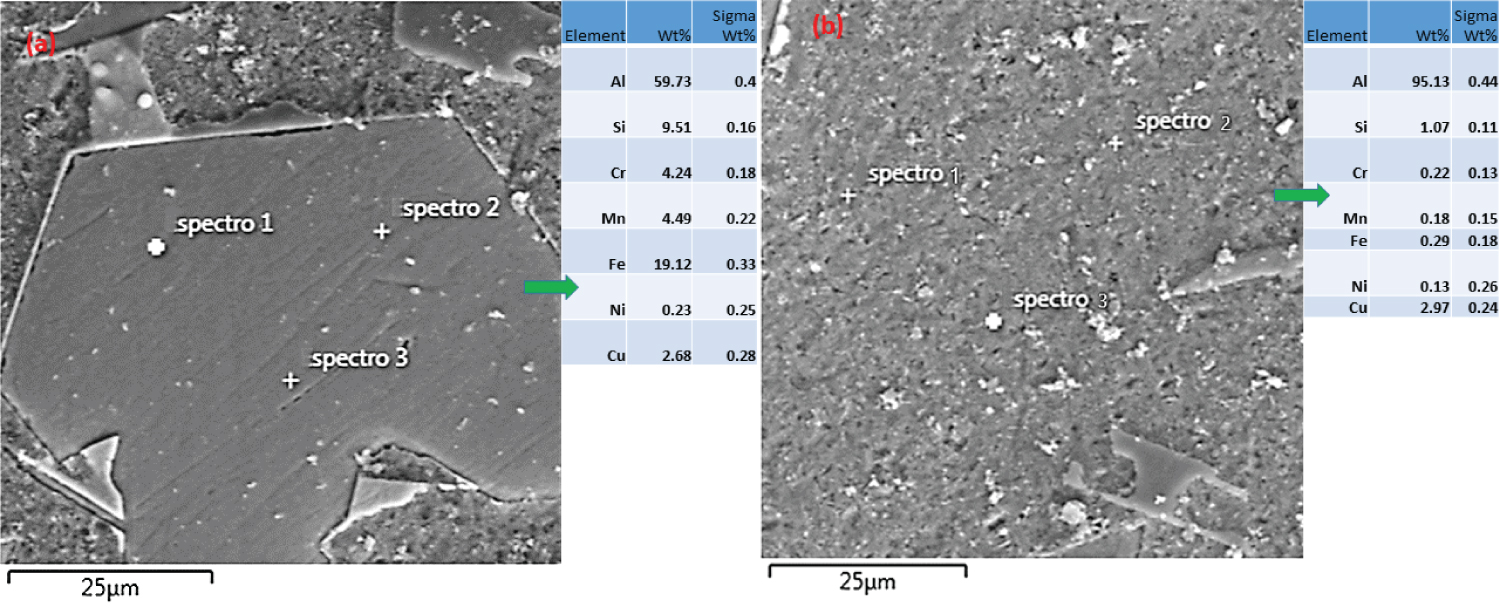
Figure 2: EDS punctual analysis for.....
EDS punctual analysis for Al-α alloy: a) At the polygonal morphology; b) At the rough morphology.
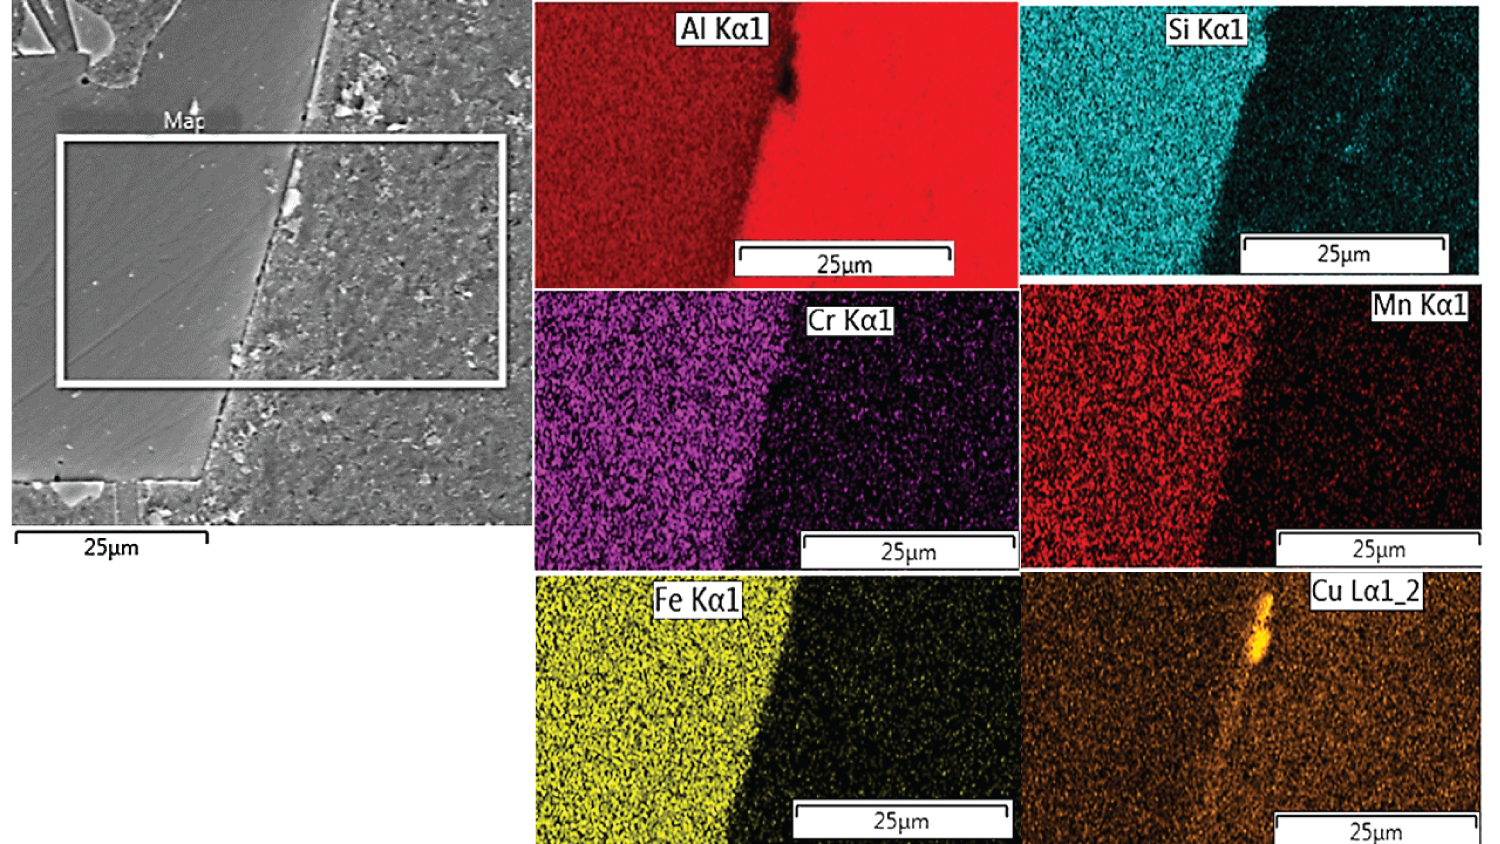
Figure 3: EDS element maps at the polygonal....
EDS element maps at the polygonal and at interface between rough morphologies and Al-α alloy phase.
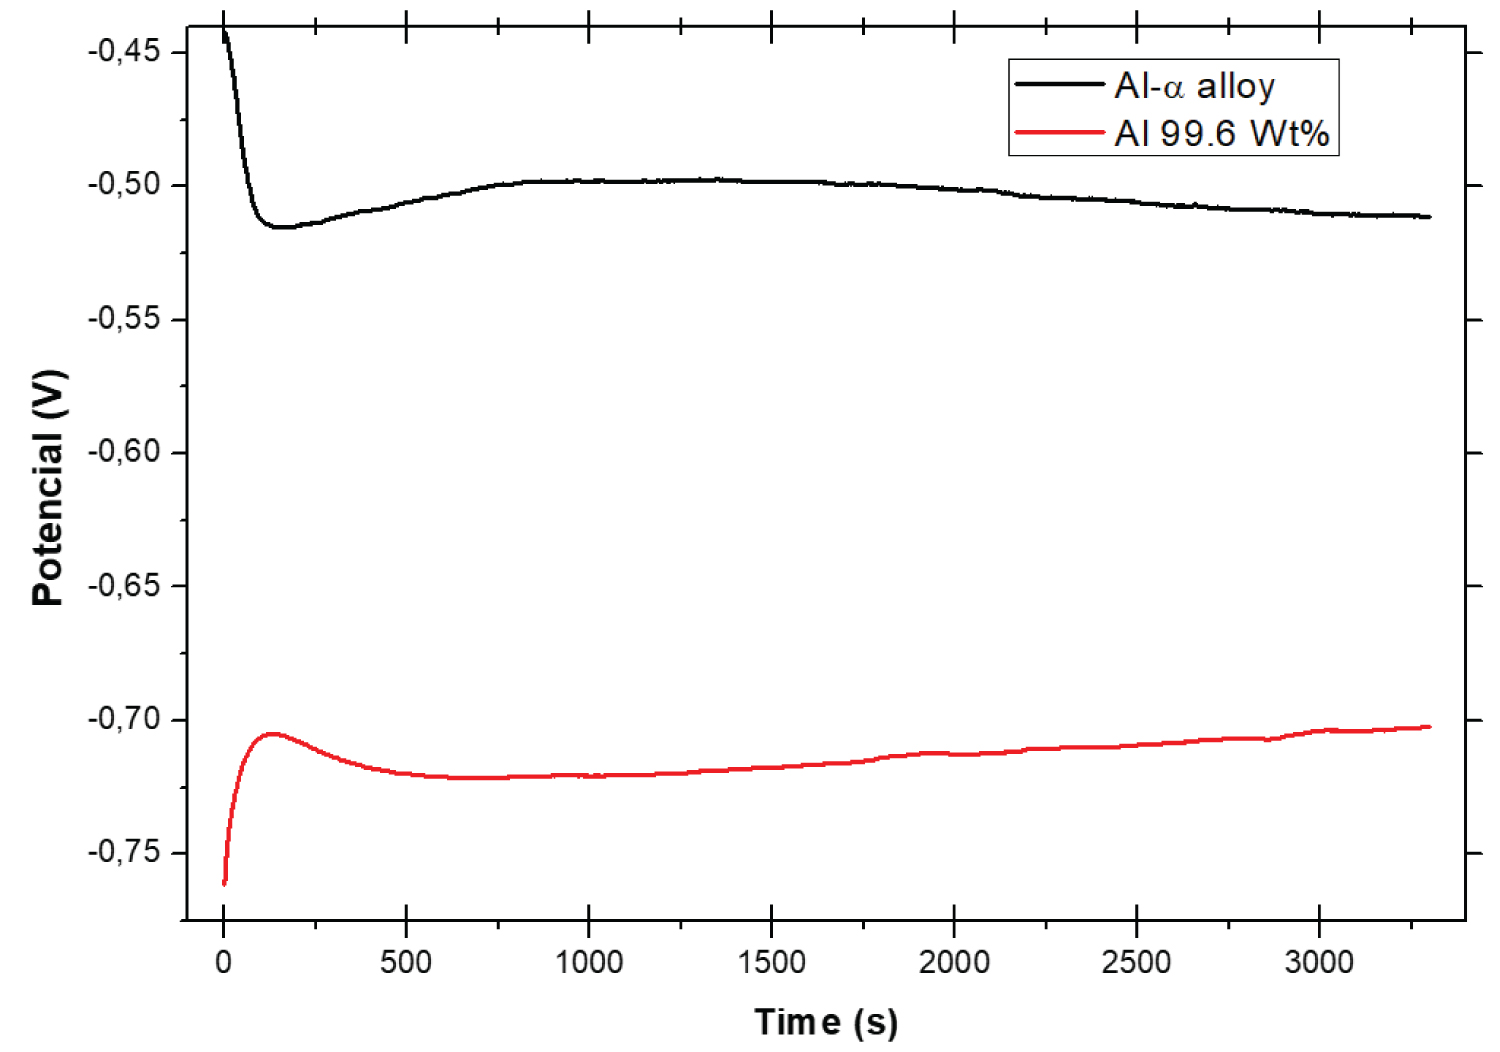
Figure 4: Open circuit potential (OCP) reactions....
Open circuit potential (OCP) reactions versus saturated calomel electrode (ECS) for the Al-α and pure Al alloys samples in 0.1 mol/L sulfuric acid medium, aerated at 24 ℃.
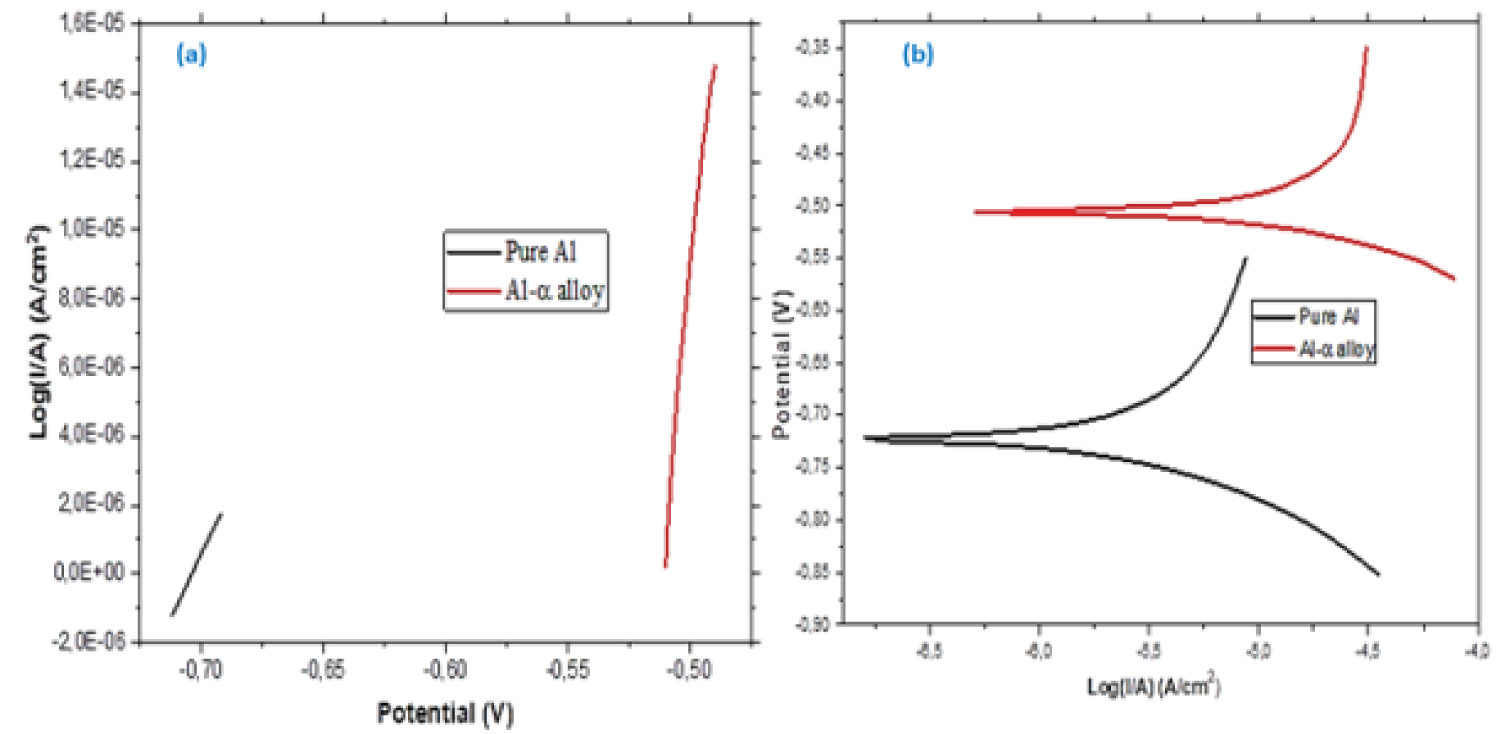
Figure 5: (a) Micro-polarization technique.....
(a) Micro-polarization technique; b) Macro-polarization technique.
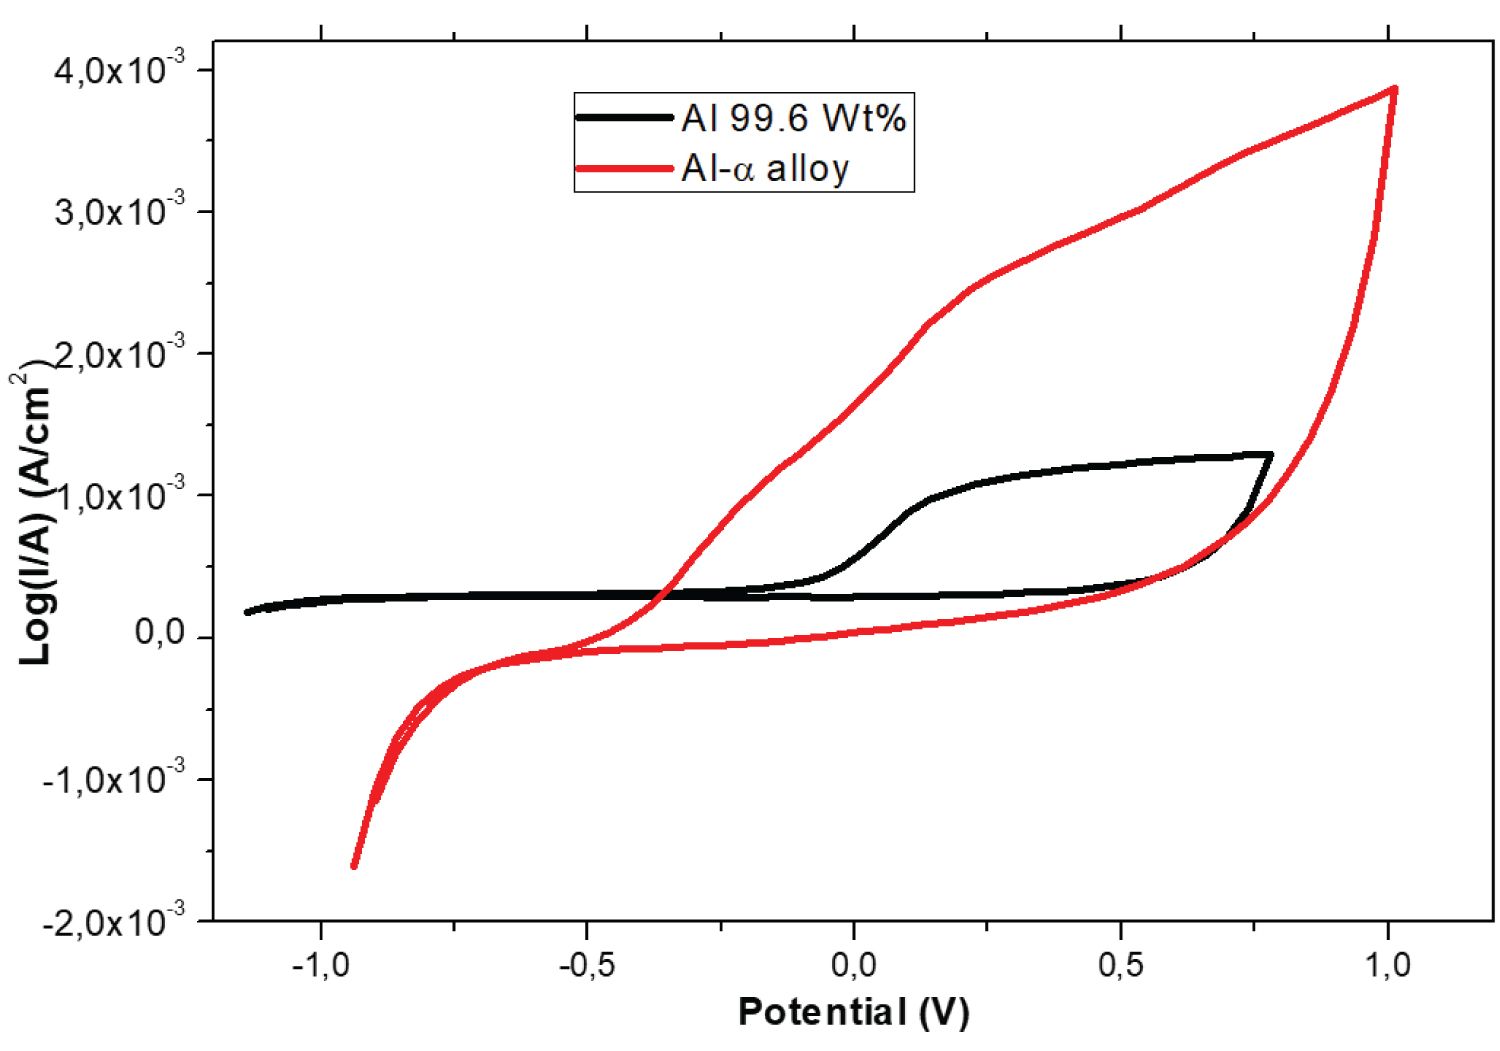
Figure 6: Cyclic voltammetry of pure aluminum.....
Cyclic voltammetry of pure aluminum and Al-α alloy samples at 0.1 mol/L H2SO4 medium, solution aerated at 24 ℃.
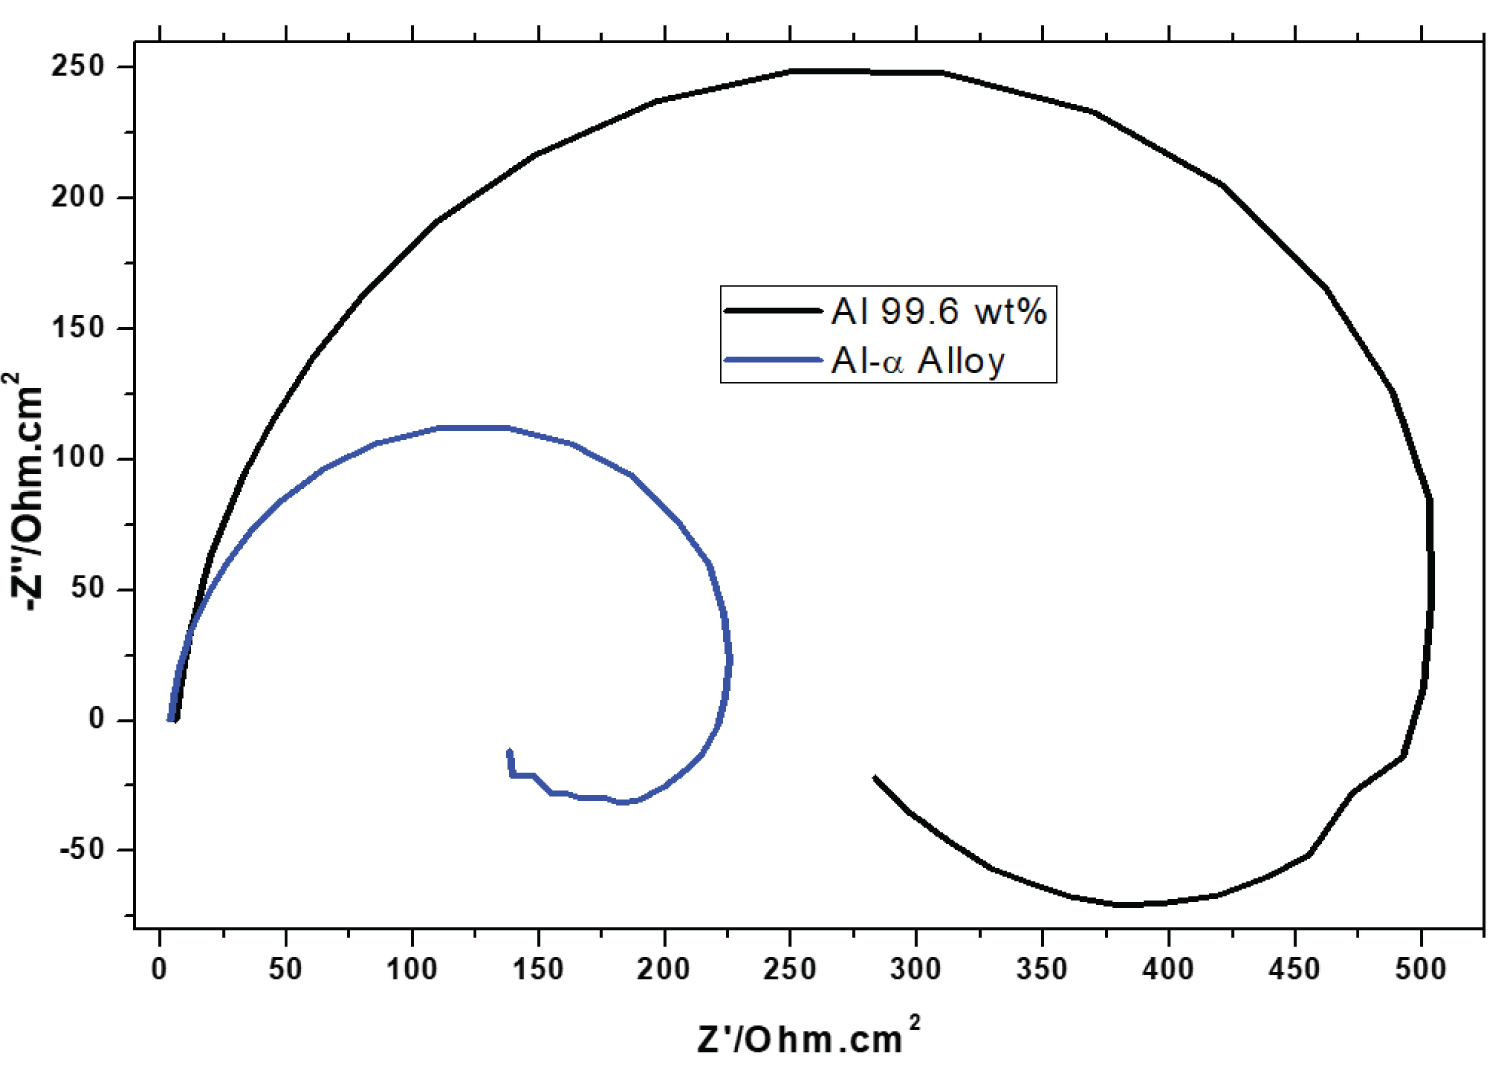
Figure 7: The EIS Nyquist plots of pure.....
The EIS Nyquist plots of pure Al and Al-α alloy samples in 0.1 mol/L H2SO4 medium, in aerated solution and at 24 ℃.
Tables
Table 1: Chemical compositions in percentage weight of Al alloy and pure Al samples, obtained by X-ray fluorescence technique.
Table 2: Electrochemical parameters for the pure Al and the Al-α alloy in H2SO4, 0.1 mol/l aerated and at 24 ℃.
References
- Dash M, Makhlouf M (2001) Effect of key alloying elements on the feeding characteristics of aluminum-silicon casting alloys. Journal of Light Metals 1: 251-265.
- Orozco-González P, Castro-Román M, Muñiz-Valdez R, Luna-Álvarez S, Equihua-Guillén F, et al. (2016) Formation and crystal structure of the t phase in the Al-Fe-Mn-Si system. Materials Letters 180: 277-279.
- Backerud L, Chai G, Tamminen J (1990) Solidification characteristics of aluminum alloys. Oslo, Norway: Foundry Alloys, AFS/Scan Aluminium 2: 81-82.
- Gao T, Wu Y, Li C, Liu X (2013) Morphologies and growth mechanisms of a-Al(Fe,Mn)Si in Al-Si-Fe-Mn alloy. Materials Letters 110: 191-194.
- Tillová E, Chalupová M, Hurtalová L (2012) Evolution of phases in a recycled al-si cast alloy during solution treatment. Scanning Electron Microscopy, 411-438.
- Yu J (2016) Formation of Intermetallic Phases in Al-10Si-0.3Fe based Alloys. Doktor der Ingenieurwissenschaften. angefertigt am Helmholtz-Zentrum Berlin für Materialien und Energie Institut für Angewandte Materialforschung, Berlin.
- Taylor JA (2012) Iron-containing intermetallic phases in Al-Si based casting alloys. Procedia Materials Science 1: 19-33.
- Cao X, Campbell J (2003) The nucleation of fe-rich phases on oxide films in al-11.5si-0.4mg cast alloys. Metallurgical and Materials Transactions A 34: 1409-1420.
- Kuijpers NCW, Vermolen FJ, Vuik C, Koenis PTG, Nilsen KE, et al. (2005) The dependence of the ß-AlFeSi to a-Al(FeMn)Si transformation kinetics in Al-Mg-Si alloys on the alloying elements. Materials Science and Engineering: A 394: 9-19.
- Gao T, Hu K, Wang L, Zhang B, Liu X (2017) Morphological evolution and strengthening behavior of a-Al(Fe,Mn)Si in Al-6Si-2Fe-xMn alloys. Results in Physics 7: 1051-1054.
- Otani LB, Soyama J, Zepon G, e Silva AC, Kiminami CS, et al. (2017) Predicting the formation of intermetallic phases in the al-si-fe system with mn additions. Journal of Phase Equilibria and Diffusion 38: 298-304.
- Kaiser MS, Sabbir SH, Kabir MS, Soummo MR, Nur MA (2018) Study of mechanical and wear behaviour of hyper-eutectic al-si automotive alloy through fe, ni and cr addition. Materials Research 21: 1-9.
- Ferreira T (2016) Development of rich layers in intermetallic a-Alx(Fe,Mn,Cr)ySiz in Al-Si alloy by controlled solidification. Universidade Tecnológica Federal do Paraná, Departamento de Mecânica, Programa de pós-graduação em Engenharia Mecânica. Master's Dissertation, Ponta Grossa-PR, Brazil, in Portuguese.
- Dinnis CM, Taylor JA, Dahle AK (2015) As-cast morphology of iron-intermetallics in Al-Si foundry alloys. Scripta Materialia 53: 955-958.
- Makhlouf MM, Apelian D (2002) Casting characteristics of aluminum die casting alloys. The Advanced Casting Research Center Worcester Polytechnic Institute Worcester, Massachusetts 5-18.
- Gashti SO, Fattah-alhosseini A, Mazaheri Y, Keshavarz MK (2016) Effects of grain size and dislocation density on strain hardening behavior of ultrafine grained AA1050 processed by accumulative roll bonding. Journal of Alloys and Compounds 658: 854-861.
- Isadarea AD, Aremob B, Adeoyec MO, Olawalec OJ, Shittu MD (2013) Effect of heat treatment on some mechanical properties of 7075 aluminium alloy. Materials Research 16: 190-194.
- Ahn S, Pathan S, Koo J, Baeg C, Jeong C, et al. (2018) Enhancement of the mechanical properties in al-si-cu-fe-mg alloys with various processing parameters. Materials (Basel) 11: 2150.
- Kubota M, Rainforth WM (2008) Properties of mechanically milled and spark plasma sintered Al-15 at.% MgB2 composite materials. Composites Science and Technology 68: 888-895.
- Xu C, Xia K, Langdon TG (2007) The role of back pressure in the processing of pure aluminum by equal-channel angular pressing. Acta Materialia 55: 2351-2360.
- (2014) Standard test method for conducting potentiodynamic polarization resistence measurements. G59-97, ASTM, West Conshohocken.
- Pourbaix M (1974) Atlas of electrochemical equilibria in aqueous solutions. NACE, (2nd edn), Houston.
- Prabhu D, Rao P (2017) Corrosion behaviour of 6063 aluminium alloy in acidic and in alkaline media, Arabian Journal of Chemistry 10: S2234-S2244.
- (2015) Standard practice for calculation of corrosion rates and related information from electrochemical measurements. G102 - 89, ASTM, West Conshohocken.
- (2002) Control of external corrosion on underground or submerged metallic piping systems. RP0169 - 2002, NACE Houston.
- Danaie M, Asmussen RM, Jakupi P, Shoesmith DW, Botton GA (2013) The role of aluminum distribution on the local corrosion resistance of the microstructure in a sand-cast AM50 alloy. Corrosion Science 77: 151-163.
- Bessone JB, Mayer C, Juttner K, Lorenz WJ (1983) AC-impedance measurements on aluminium barrier type oxide films. Electrochimica Acta 28: 171-175.
- Lenderink HJK, Linden MVD, De Wit JHW (1993) Corrosion of aluminium in acidic and neutral solutions. Electrochimica Acta 38: 1989-1992.
- Kharitonov DS, Dobryden IB, Sefer B, Zharskii IM, Claesson PM, et al. (2018) Corrosion of AD31 (AA6063) Alloy in Chloride-Containing Solutions. Protection of Metals and Physical Chemistry of Surfaces 54: 291-300.
- Arthanari S, Jang JC, Shin KS (2019) Corrosion performance of high pressure die-cast Al-Si-Mg-Zn alloy in 3.5 wt% NaCl solution. Journal of Alloys and Compounds 783: 494-502.
Author Details
Moises Meza Pariona*
Department of Material Engineering, State University of Ponta Grossa, Ponta Grossa, PR, Brazil
Corresponding author
Moises Meza Pariona, Department of Material Engineering, State University of Ponta Grossa,Ponta Grossa, PR, Brazil.
Accepted: August 05, 2021 | Published Online: August 07, 2021
Citation: Pariona MM (2021) Effects of the Aluminum Alloy with Intermetallic a Phase on the Microstructural and Corrosion Resistance. Int J Robot Eng 6:035.
Copyright: © 2021 Pariona MM. This is an open-access article distributed under the terms of the Creative Commons Attribution License, which permits unrestricted use, distribution, and reproduction in any medium, provided the original author and source are credited.
Abstract
The aluminum alloy with intermetallic α-Al15(Fe,Mn,Cr)4Si2 phase with polygonal morphology, denoted by Al-α alloy was processed by controlled solidification and this alloy was studied in order to evaluate the microstructure, microhardness, corrosion resistance and electrochemical impedance when this alloy was immersed in an electrolytic medium at 0.1 mol/L solution of sulfuric acid.
The intermetallic α-Al15(Fe,Mn,Cr)4Si2 with polyhedron morphology presents a microhardness of 483 HV and being much higher than pure aluminum. The polarization resistance of the pure Al is much higher than Al-α alloy and the corrosion rate in pure Al is low, however, the corrosion rate in Al-α alloy is moderate. The Al-α alloy electrode presents a larger area of the voltammogram than the pure Al electrode and pure Al presents a larger region passivity, however, through Nyquist diagram, both samples presented the capacitive semicircle and inductance region. Being so, the polarization resistance was a lot bigger in pure Al than the Al-α alloy, and these results were similar to result of micro polarization. This alloy is suitable for use in many automotive applications increasing lifetime of its components, due to, it has low density, high microhardness and in sulfuric acid medium has noble behavior and presents a good corrosion resistance, and a low corrosion rate.
Keywords
Controlled solidification, α-Al15(Fe,Mn,Cr)4Si2, Microstructure, Microhardness, Corrosion resistance, Electrochemical impedance
Introduction
Aluminum alloy are getting increased attention mainly because of their application in the automotive and aerospace industries and there is a significant scientific and industrial interest in use of Al-Mg-Si-Mn-Fe alloys in automotive applications to reduce the weight and production cost of vehicles, besides, only in the last five decades have attempts been made to study the feeding mechanisms of aluminum-silicon alloys, according to statement of Dash and Makhlouf, [1]. However, Orozco-González, et al. [2] had observed, in the dilute aluminum alloys, two of the phases that are commonly encountered as secondary phase and have been the subject of much research the α-AlFeSi and β-AlFeSi phases. Where, the α phase is usually described as having a Chinese script morphology and cubic or hexagonal crystal structure and the β phase is generally described as having a plate-like morphology and monoclinic crystal structure. Furthermore, Backerud, et al. [3] explained in his work, which the intermetallic component α-Al15(Fe,Mn)3Si2 may present polygonal morphology when its precipitation occurs from a primary reaction, or it may present a "Chinese-script" morphology, when formed from a post reaction-dendritic, besides, these last authors emphasize, which these characteristics are determined by the Mn and Fe content present in the alloy. Then, these same authors verified, if the sample is cooled slowly (0.1 ℃/s), primary crystals α-Al15(Fe,Mn)3Si2 with polyhedral morphology are obtained, however, if the cooling rate is slightly higher (0.3 ℃/s), the primary component α-Al15(Fe,Mn)3Si2 may have a morphology in dendritic form and at cooling rates above 0.5 ℃/s, α-aluminum will develop as the primary phase, and the α-Al15(Fe,Mn)3Si2 will have the morphology of a post-dendritic precipitate with typical "Chinese-script" morphology. Besides, Gao, et al. [4] explained the growth stages of the intermetallic α-Al(Fe,Mn)Si tend to have a rhombic dodecahedron morphology. Gao, et al. [4] explained the growth stages of the intermetallic α-Al(Fe,Mn)Si reaches to have a rhombic dodecahedron morphology. Although, with backscattered electron image the primary intermetallic compound α-Al15(Fe,Mn)3Si2 with polyhedral morphology sedimented at 600 ℃ for 4 hours was observed by Dash and Makhlouf [1].
Tillová, et al. [5] have discussed and verified that the intermetallic β-Al5FeSi phase is seen as harmful to the mechanical properties and this presents a monoclinic crystalline structure with highly faceted platelet morphology, with microstructural resembles to needles. Due to this morphology, it acts as efficient stress concentrators, significantly reducing the mechanical properties of the alloy, such as ductility and fracture toughness. Another similar work by Yu [6] and Taylor [7], they showed that the β-Al5FeSi phase presents a complex configuration, forming branches whose growth is lateral. According to Cao and Campbell [8], they pointed, when the molten bath is superheated at elevated temperatures (200 a 300 ℃) above the liquidus temperature, the iron compounds tend to crystallize as α-Al15(Fe,Mn)3Si2. In addition, manganese has been widely used, due to its significant cost and higher availability of this element, although, β-Al5FeSi phase of monoclinic structure tends to be suppressed and in its place forms the compound α-Al15(Fe,Mn)3Si2, this was supported by Gao, et al. [4], however, with the increase of the manganese content, the equilibrium field of the intermetallic component α-Al15(Fe,Mn)3Si2 increases, as emphasized by Backerud, et al. [3].
During homogenization, plate-like β-AlFeSi phase transforms to a more rounded α-Al(FeMn)Si phase, which are more favorable for the extrusion process, beside, the influence of the alloying elements on the rate of the intermetallic β-to-α transformation were studied by studied Kuijpers, et al. [9], furthermore, according to their investigation these author stated, iron is a common impurity element in aluminum alloys, for instance, in Al-Si foundry alloys, iron forms intermetallic compounds that have long been known to be detrimental to mechanical properties, moreover, the morphology of iron-containing intermetallic is often cited as the contributing cause of their negative effects, where the plate-like phases, such as, β-Al5FeSi, nevertheless, such as, α-Al15-(Fe,Mn)3Si2 are considered as more harmful than script-type phases. Meanwhile, formation of β-Al15FeSi phase can be suppressed in two ways: Addition of sufficient manganese, in alloys without manganese or with high cooling rates, the former leads to the formation of α-Al15(Fe,Mn)3Si2, while in the latter case, α-Al8Fe2Si is formed. Notwithstanding, Gao, et al. [10] and Otani, et al. [11] investigated, in order to minimize the disadvantage of β-Al5FeSi, their researches have been focused on changing the morphology of this phase, adding neutralizing elements, e.g., Be, Mn, Cr or V, it is a commonly applied method, among which Mn element is the most efficient. When the total amount of Fe, Mn and Si is less than 18 wt.%, the primary phase Al15(Fe,Mn)3Si2 will form, which is usually marked as α-Al(Fe,Mn)Si for short. The α-Al(Fe,Mn)Si phase exhibits a body centered cubic structure and its preferred morphology is Chinese script.
Kaisera, et al. [12] presented the applications of this type of alloys. Hypereutectic aluminium-silicon alloys are used in applications that require high resistance to wear, corrosion, good mechanical properties, low thermal expansion and reduced density. Their properties are of greatest attention to the automobile industry for the fabrication of fuel-efficient vehicles, using lightweight components produced from these alloys, such as, connecting rods, pistons, cylinder liners and engine blocks. The good mechanical properties and high resistance to wear are basically recognized as hard primary silicon particles spread in the metal matrix. The wear resistance can, however, also be affected by Si in the eutectic matrix. The most investigated of these cast alloy groups are A356/A357 (Al-Si-Mg) and B319 (Al-Si-Cu) systems, in the latter case, copper increases thermal endurance but reduces corrosion resistivity and magnesium, also acts as a precipitation hardening element and has good corrosion resistance.
The aluminum alloy with intermetallic α-Al15(Fe,Mn,Cr)4Si2 phase have polygonal morphology was processed by controlled solidification, this allow was studied in order to evaluate the microstructure, microhardness, corrosion resistance and electrochemical impedance when this alloy was immersed in electrolytic medium at 0.1 mol/L solution of sulfuric acid. The results were compared in relation to pure aluminum. This alloy is suitable for use in many automotive applications increasing lifetime of its components, due to, it has low density, high microhardness and in sulfuric acid medium has noble behavior and presents a good corrosion resistance, and a low corrosion rate.
Material and Methods
From commercial raw materials the alloy with chemical composition used in this work was casted and X-ray fluorescence was previously used to determine quantitatively the composition of each sample and Table 1 shows the compositions in weight of each sample. The elaboration of the alloy that belongs to Al-Si-Cu-Fe-Mn-Cr system are within the limits of chemical composition of the primary formation of the intermetallic α-AlX(Fe,Mn,Cr)YSiZ. The preparation of alloy was made from the fusion of the ingots in the vertical furnace, so, all the information of the alloy casting process is found in the dissertation of Ferreira [13]. After casting the alloy, the samples were cut, embedded and sanded for microstructure analysis in an optical microscope Olympus BX-51 and also in microscope (SEM-FEG) with EDS, Tescan model Mira 3. Furthermore, Vickers hardness (VH) was measured on the material.
For the corrosion tests, the samples were cut, embedded and sanded, the following measurement techniques were employed: Open circuit corrosion potential, linear polarization around of the corrosion potential (Ecorr), cyclic voltammetry and impedance spectroscopy, as well as quantify of the corrosion rate was performed to know the information about kinetic of anode and cathodic reactions. Corrosion tests were performed in an electrochemical cell with three electrodes; the reference electrode (SCE), the counter electrode (platinum wire) and the work electrodes constituted by aluminum alloy and pure Al. The electrolytic medium was a 0.1 mol/L solution of sulfuric acid, maintaining a temperature at 24 ℃ through a Brookfield TC 501 thermostat. The tests were performed in an Autolab potentiostat model PGSTAT 30, the GPES software and the FRA software, version 4.9 of Autolab were used to collect. At last, impedance spectroscopy tests were accomplished to represent the results in Nyquist diagram.
In this work the Vickers microhardness test was performed, with applied loads of 100 [gf], for a dwell time of 15 s.
Results and Discussion
To facilitate the discussion, some nomenclatures were adopted, so that, the Al-alloy with intermetallic component α-Al15(Fe,Mn,Cr)4Si2 what present polygonal morphology was denoted by "Al-α" and the Al 99.99 wt.% was denoted by "pure Al".
The physical properties measured of Al alloy, whose density was 2093 kg/cm3 and of pure Al was 2700 kg/cm3. These properties were measured by Archimedes principle.
Microstructural analysis
The microstructural analysis was carried out using an optical microscopy and high-resolution scanning electron microscope (SEM-FEG) with EDS. Through the phase-contrast optical microscopy a suitable illumination was selected to better visualize the phases present in the material studied, in Figure 1 is shown the result of microstructural analysis of Al-α alloy, in the micrograph is shown a distribution of polygonal morphology with homogeneous or smooth characteristic, but, in the low-magnification optical microscopy (Figure 1a), a morphology type "Chinese script morphology" is observed by the phase-contrast optical microscopy, which correspond to intermetallic phase type α-Al15(Fe,Mn,Cr)4Si2, this study was previously confirmed by Ferreira [13], also, for the phase α-Al15(Fe,Mn)3Si2 similar results were discussed by several authors, between them, Orozco-González, et al. [2] and Backerud, et al. [3]. Besides, when is amplified the optical micrograph (Figure 1a), two distinct phases are clearly observed (Figure 1b-c). Meanwhile, around the polygonal morphology, a morphology with coarse or rough characteristic can observe and these characteristics can be elucidated at the interface of these morphologies (Figure 1d-e).
Furthermore, EDS punctual analysis for Al-α alloy was done, such as, at the polygonal morphology and rough morphology, at right-hand side of the tables that corresponding to each microstructure, the present elements concentration can be observed. At first table (left side) of Figure 2 there are low concentration of Al, meanwhile, high concentrations appear in this table of Fe, Si, Cr, Mn and Ni than at second table (right side) of Figure 2, however, high concentration of Al presents in this last table.
The selected black and white area (Figure 3) was mapped using the EDS technique, and according to the chemical analysis the elements shown in this figure were determined; though, the highest intensity of the area corresponds to the referred element. Therefore, the EDS element maps present at Al-α alloy that is shown in Figure 3, we note higher concentration of Al element prevails at the rough characteristic than the polygonal morphology, which is confirmed at second table of Figure 2. However, the elements: Fe, Si, Cr and Mn present higher concentration at region of the polygonal phase; though, these elements have low concentration at the rough region, this result is confirmed by EDS punctual analysis (Figure 2), while the Cu element has a slightly higher concentration at the rough region, and the Ni element was not detected, a similar work was done by Backerud, et al. [3].
Strengthening this study, the solidification by differential thermal analysis (DTA) of alloy with cooling at 5 ℃/min was carried out, by Ferreira [13]. This author identified precipitation of phases rich in pro-euthetic Fe-Al15(Fe,Mn)3Si2 and/or Al5FeSi, besides, main euthetic reaction involving precipitation of (Si) and phases containing-Fe. In addition, an analysis by X-ray diffractometry (Cu-kα) of this alloy, executed by this same author, the phases α-Al15(Fe,Mn,Cr)4Si2, α-Al, Si, Al2Cu e Al3Cu2Ni have been identified. Thus, our microstructural study is corroborated with the results of this study.
For the phase α-Al15(Fe,Mn)3Si2 with characteristic similar to phase α-Al15(Fe,Mn,Cr)4Si2 was discussed in the literature. Therefore, several researchers investigated this theme and that confirm our result, among them, Cao and Campbell [8] confirmed that the iron compounds tend to crystallize as α-Al15(Fe,Mn)3Si2, thus this element prevails at the polygonal morphology, which is rich in Fe, Mn and Cr, also, with the increase of the manganese content, the equilibrium field of the intermetallic component α-Al15(Fe,Mn)3Si2 increases, as emphasized by Backerud, et al. [3] and Dinnis and Taylor [14]. Besides, according to study assessed by Kuijpersa, et al. [9], which during this homogenization, plate-like β-AlFeSi phase transforms to a more rounded α-Al(FeMn)Si phase, which are more favorable for the extrusion process, the influence of the alloying elements, in particular the Mn and Si concentration influence on the β-to-α transformation rate. Moreover, Makhlouf and Apelian, et al. [15] and Otani, et al. [11], they had observed that the intermetallic compound α-Al15(Fe,Mn)3Si2 have a polyhedral morphology, besides, Backerud, et al. [3] explained in his work, which the intermetallic component α-Al15(Fe,Mn)3Si2 may present polygonal morphology when its precipitation occurs from a primary reaction, or it may present a "Chinese-script" morphology, also, this fact were corroborated by Dinnis and Taylor [14] and Otani, et al. [11]. The α-Al(Fe,Mn)Si phase exhibits a body centered cubic structure and its preferred morphology is Chinese script, pointed out by Gao, et al. [10]. Based on the literature results, the polygonal morphology presented and discussed in this paper is of type α-Al15(Fe,Mn)3Si2 or Al-α alloy. It can be verified in Figure 2 and Figure 3, at the polygonal morphology the elements Fe, Si, Cr and Mn have high concentration in this morphology.
A systematic study was presented to investigate the variations of microstructure, mechanical properties, and strain hardening on a commercially pure aluminum AA1050 at room temperature, through optical micrograph of annealed sheet, by Gashti [16], they showed a homogeneous microstructure, with a geometric characteristic elongated and polygonal deformed and some of the grain boundaries are not clear due to a large number of dislocations that present. Therefore, the microstructure of the Al-α alloy and pure Al are different, although the Al-α alloy present the polygonal morphology, however, around the polygonal morphology presents coarse or rough characteristic, while the pure Al present polygonal deformed and elongated.
Vickers microhardness measurements
The Vickers microhardness was carried out in the polygonal morphology and rough characteristic of the microstructure of Figure 1. At polygonal morphology the microhardness Vickers (HV) was 728 ± 8, however, at rough characteristic was 90 ± 10 HV.
Several authors have studied the Vickers microhardness, including Tillová, et al. [5], who, studying the intermetallic phases in Al-Si recycled alloys presents a microhardness of 483 HV, in addition, Isadarea, et al. [17] studied Mechanical Properties of 7075 Aluminum Alloy, they found for this alloy the microhardness of 201 HV, however, the microhardness of 567 HV for Al-Si-Cu-Mg-Fe extruded alloy was measured by the authors Ahn [18]. Though, some authors, Kubota [19] and Xu, et al. [20] determined the microhardness of pure aluminum, around 50 HV. Meanwhile, our result of microhardness in polygonal morphology was higher than the alloys presented by the authors, beside; also, the microhardness of our alloy was much higher than pure aluminum.
Electrochemical techniques
Open-circuit corrosion: The corrosion potential (Ecorr) or open circuit potential is determined after 3300s of immersion in the electrolyte under study, as stipulated by ASTM standard G59-97 [21]. Figure 4 shows the behavior of the corrosion potentials of the samples as a function of time for the two samples tested. Where the pure Al was considered as a reference of comparison, similar estude.
OCP of an electrode reflects the thermodynamic parameter which guides us about the thermodynamic tendency of that metallic materials to participate in the electrochemical corrosion with the electrolyte or neighboring medium. OCP shows the relationship between the electrode potential and the immersion time, indicating the stability of the sample in the electrolyte. So, open circuit potential is important since the metal with the low open potential will dissolve faster in the electrolyte than the metal with high open circuit potential.
The sample of the Al-α alloy presented the initial Ecorr of -0.082 V, then falls sharply to -0.102 V and stabilizes at -0.106 V at the test end. However, for the sample of pure Al initially a potential was of -0.006 V, in which the potential varies very little and stabilizes at -0.005 V at the test end. The potential of the Al-α alloy behaves with a tendency to decrease the potential from 2000 s, while, from this same time interval, the pure Al sample presents a tendency to increase the potential.
The open circuit potential (Ecorr) reflects the composite results of the electrochemical reactions which take place at the electrode/solution interface. From the Figure 4 it is clearly visible that the most noble Ecorr was observed for the Al-α alloy than the pure Al, which indicate the formation and thickening of the protective passive film on their surfaces of the Al-α alloy, whereby, both materials seek the thermodynamic stability of the sample in the electrolyte.
In this experiment we used the saturated calomel as the reference electrode, because the potential -0.106 V at the test of the Al-α alloy in reference to the standard hydrogen electrode is +0.135 V, however for the pure Al the potential -0.005 V in reference to the standard potential is +0.236 V. In this Al-α alloy the aluminum concentration prevails (Table 1), so according to Pourbaix diagram [22] both potentials are found in the passive region. A similar viewpoint was expressed by Prabhu and Rao [23].
Determination of corrosion rate: To calculate the corrosion rate, micro and macro linear polarization techniques were used. The micro polarization technique consists in applying 10 mV for more and 10 mV for less around the Ecorr, as stipulated in standard ASTM G59-97 [21], the result is shown in Figure 5a and the polarizing resistance (Rp) is defined as the inverse of the angular coefficient of the straight line of Figure 5a, whose result is displayed in Table 2. Moreover, to determine the Tafel constants (βa, cathode beta and βc, anodic beta) in H2SO4, the macro polarization technique was performed, for this, a potential of ± 150 mV around Ecorr was applied in the samples in study, whose result is shown in Figure 5b and the Tafel constants are presented in Table 2.
To calculate the corrosion current (Icorr) was used the equation proposed by Stern-Geary in ASTM G59-97 [21] and the corrosion rate (CR) is in mm/year, according to ASTM G102-89 [24]. For this calculation, the Al element was considered the majority, according to Table 1. Table 2 presents the experimental data and calculation of the corrosion current and corrosion rate for each sample.
As is well known, the polarization resistance is related to the difficulty of load transfer or electric current flow between electrolyte and the sample. According to this result of Table 2, the polarization resistance of the pure Al is much higher than Al-α alloy. In addition, in this table the Icorr in conditions of almost equilibrium is higher of the alloy Al-α than pure Al. Thus, a lower electric current implies a higher polarization resistance.
The Tafel constants activate the cathodic and anodic electrochemical processes. However, the electrochemical processes that occur in electrodes in acid medium that corresponds to this work are as follows: At cathode in platinum electrode, the reaction occurs:
2H+ 2e- → H2 (1)
It means that hydrogen is reduced on the electrode surface at the solution interface. However, at node in the work electrode, the following reaction occurs:
Al → Al+3 + 3e-1, (2)
Reacting Al with water, inducing the formation of Al's oxide on the metal surface, at the metal-water interface observed Table 2. The activation of βa is lower in the pure Al than Al-α alloy, this implies the lower production of Al 3+ anions in the pure Al electrode surface than in Al-α alloy. Then the Al-α alloy electrode is less stable than the pure Al. On the other hand, the βc of the Al-α alloy is smaller in absolute value in relation to the pure Al, indicating a greater activation of the cathodic reaction of the hydrogen reduction on the alloy, suggesting that the greater reaction of hydrogen evolution is favored on the alloy surface, this resulted was supported by Prabhu and Rao [23].
The microstructure of the Al-α alloy and pure Al are different. The Al-alloy with intermetallic component α-Al15(Fe,Mn,Cr)4Si2 presents a polygonal morphology, meanwhile, around the polygonal morphology has a coarse or rough characteristic and these characteristic can be elucidated at the interface of these morphologies (Figure 1c and Figure 1d), where the pure Al presents only a morphology deformed and elongated. As is known, the cathodic and other anodic regions are established by the morphological characteristic of the alloy, because the Al-α alloy has two phases, although the pure Al has only one phase, thus generating a galvanic microcell, which explains the higher corrosion rate in the Al-α than in pure Al.
In aerated sulphuric acid medium the presence of the intermetallic phase α-Al15(Fe,Mn,Cr)4Si2 that is present in the aluminum matrix, which can be verified, the corrosion rate of this alloy is higher when compared to pure Al (see Table 2), for the reason that was explained in the previous paragraph. These values mean that the corrosion rate in pure Al is low, however, the corrosion rate in Al-α alloy is moderate according to the standard NACE Standard RP0169 [25].
Cyclic voltammetry: Figure 6 shows the cyclic voltammograms of pure Al aluminum and Al-α alloy samples at 0.1 mol/L H2SO4 medium. The initial potential was stabilized at -1.0 V and the final potential was +1.0 V and the scan velocity was 50 mV/s.
For the sample of the Al-α alloy, around -1.0 V to -0.5 V it has the cathodic behavior, showing a high reaction of hydrogen evolution, which is also verified in the state in almost equilibrium, according to the calculation of βc in Table 2, moreover, at approximately -0.5 V has the beginning of an anodic current or oxidation reaction, which means the possible dissolution on the work electrode surface of the α-Al15(Fe,Mn,Cr)4Si2 phase, therefore, as the applied potential increases, the current density increases, too, meaning an increase of the sample dissolution that is associated with current density increases, beside, at the maximum applied potential 1.0 V, the current density is approximately 4.0 × 10⁻³ A/cm2. After this direction, the potential in opposite direction in the electrode was applied, where the dissolution decreases when the potential decreases and from 0.5 V and whose variation of current is very small. Therefore, possibly allowing the formation of aluminum oxides, iron oxides, etc., this is a function of the elements that exist in the work electrode (Table 1), since; the test was performed in aerated environment.
Besides, according to Figure 6 for the pure Al sample, at the potential range of -1.0 to 0.0 volts, the current is around zero and so it has the passivity behavior, in a similar way to the βc measured in Table 2, which it presents in this electrode low hydrogen reduction, thus, both measures lead to similar result. However, the increase of the anodic current in this electrode appears in approximately 0.0 V, due to aluminum dissolution generating Al+3 ions. In this figure can be observed that when the potential increases, the current also increases, reaching a maximum current of 1.0 × 10⁻³ A/cm2 in 1.0 V, after the decreasing potential in around 0.5 V, so the sample behaves with passivity characteristic again and with a very small constant current. Comparing at 1.0 V, the current density of pure Al is 3 times lower than the Al-α alloy.
Nevertheless, it can be verified at -1.0 V potential, the cathode current of hydrogen evolution or reduction reaction in the Al-α alloy is approximately -2.0 × 10⁻³ A/cm2, however, in relation to pure Al, where the cathode current is close to zero. Then, we can affirm through the cyclic voltammogram presented in Figure 6, that the hydrogen evolution reaction is appreciable on the surface of the Al-α alloy in relation to the reference sample.
This last result has the same tendency with the result of Table 2, although the electrochemical parameters of this table were measured in a state of almost equilibrium, for the potential range ± 150 mV around Ecorr, however, the voltammetry corresponds to a dynamic state out of equilibrium. So, we verified the pure Al is more stable than the Al-α alloy in middle of the 0.1 mol/L of H2SO4, also this fact can be confirmed by the result of the corrosion rate of Table 2 and also, it can be confirmed by the result of the open circuit potential of Figure 1, because the corrosion rate of the Al-α alloy is little higher in relation to the pure Al. The cyclic voltammetry is related to the loads generated in the double layer of the electrode, according to Figure 6, the Al-α alloy electrode presents a larger area of the voltammogram than the pure Al electrode, because these areas are related to amount of stored load or simply is the capacitance of double layer, this means that Al-α alloy has greater dissolution than the pure Al, thus, we again confirm that the Al-α alloy is less stable than the pure Al, this results presented in this study are consistent with other studies [23,26].
Electrochemical impedance spectroscopy: The electrochemical behavior of the samples was characterized by electrochemical impedance spectroscopy (EIS) and the result was presented by means of the Nyquist diagram.
Figure 7 shows the Nyquist diagram for the two samples studied. In the X-axis the real impedance and in the Y-axis the imaginary impedance are represented. Analyzing the diagrams, the presence of a capacitive semicircle at the regions of low and middle frequencies and an inductance phenomenon at the high frequency range are observed. The presence of a capacitive semicircle is characteristic of the charge transfer stage, being this limiting stage due to involved electrochemical processes and this characteristic are attributed to electrical properties of the alloy surface and to presence of adsorbed hydrated oxide film at the surface, this, in turn, it is related to the properties of the aluminum oxide layer and other oxides related to elements of Table 1. Bessone, et al. [27] and Wit and Lenderink [28] pointed out that the capacitive arc is assigned to the passive oxide film of aluminum in the solution/oxide interfaces. The presence of an inductance region indicates an active dissolution of the surface at local microdefects of the oxide film. The presence of an inductance loop can be attributed to (a) Relaxation of a faradaic process associated with the anodic dissolution of the aluminum and (b) Fact of mechanism of adsorption of corrosion reaction, according to study of Kharitonov, et al. [29]. However, Arthanari, et al. [30] affirmed that inductance loop is due to the strong diffusion of corrosive ions through the surface layer and dissolution of Al. They added, the addition of Mg in alloy decreased its corrosion resistance, otherwise. However, the justifications for inductive arc, at high frequencies are controversial, presented by several authors.
In this work, the polarization resistance (Rp) was obtained by the semicircle diameter in the real axis in Figure 7. Through this technique, the solution resistance (Rs) was approximately 75 Ω for the pure Al sample and for the Al-α alloy was 50 Ω, values that correspond to beginning of the semicircle for high frequencies applied. Through the diameter of the capacitive arch (Figure 7), for pure Al the polarization resistance was 0.43 k Ω.cm2, being very close to the value determined by linear polarization (Table 2), however, the value for Rp for Al-α alloy was around 0.2 k Ω.cm2, a little higher calculated by the linear polarization technique (Table 2), Prabhu and Rao [23] and Danaie, et al. [26] investigated the electrochemical behavior of the Al alloy and their results are similar to this work.
Kaiser, et al. [12] studied mechanical and wear behavior of hyper-eutectic Al-Si automotive alloy through Fe, Ni and Cr Addition, they observed that Fe improves the hardness of the hypereutectic Al-Si automotive alloys due to formation of hard β-Al5FeSi phase, beside; Ni extends the hardness due to precipitation of Ni intermetallic into the aluminum matrix. The Fe bearing intermetallic ensues as stress raisers and points of weakness that reduce the tensile strength and ductility of the alloy, likewise, the addition of Cr change in their effectiveness to modify the harmful harder phase to α-Al(Fe,Cr)Si.
The aluminum alloy with intermetallic α-Al15(Fe,Mn,Cr)4Si2 phase has the following, characteristic, such as, it has low density, high microhardness and corrosion rate moderate in acid medium. We can considerate this alloy that has excellent mechanical properties, which makes it suitable for use in many automotive components applications, which was confirmed by Kaiser, et al. [12]. For the future, we will still need to think about decreasing vehicle weight, and economic demands for production in the automotive industry. This can be achieved by reducing the material thickness and allied to corrosion properties will be of vital importance for the properties and increasing lifetime of such components.
Conclusion
1. As a consequence of this study, the following conclusions will be highlighted.
2. The micrograph by SEM-FEG shown a distribution of polygonal morphology with two distinct phases and the concentration of the elements Fe, Si, Cr, Mn and Ni by EDS were different in each phase.
3. The primary intermetallic α-Al15(Fe,Mn,Cr)4Si2 with polyhedron morphology presents a microhardness of 483 HV and being much higher than pure aluminum.
4. The polarization resistance of the pure Al is much higher than Al-α alloy and the corrosion rate of pure Al is low, however, the corrosion rate of Al-α alloy is moderate.
5. The Al-α alloy electrode presents a larger area of the voltammogram than the pure Al electrode and pure Al presents a larger region passivity, thus, the Al-α alloy is less stable than the pure Al.
6. By Nyquist diagram, in both samples were presented the capacitive semicircle and inductance phenomenon. Being so, the polarization resistance was a lot bigger in pure Al than the Al-α alloy, and these results were similar to result of micro-polarization.
Acknowledgements
This work was entirely financed by CNPq (Brazilian National Council for Scientific and Technological Development), FINEP (Research and Projects Financing Agency) and to LABMU-UEPG laboratory.