
International Journal of Optics and Photonic Engineering
(ISSN: 2631-5092)
Volume 4, Issue 1
Research Article
DOI: 10.35840/2631-5092/4516

Article Formats
Importance of Illumination in a Non-Contact Photoplethysmography Imaging System for Burn Wound Assessment
C Ikenna Nwafor1*, Weirong Mo1, Darlene R King1, Aadeesh Shringarpure1, Kevin D Plant1, John J Squiers1,2,3, Tobechukwu O Nwafor1, Ronald D Baxter1, Rachit Mohan1, Weizhi Li1, Xu Zhang1, Eric W Sellke1, Wensheng Fan1, J Michael DiMaio1,3 and Jeffrey E Thatcher1
Table of Content
Figures
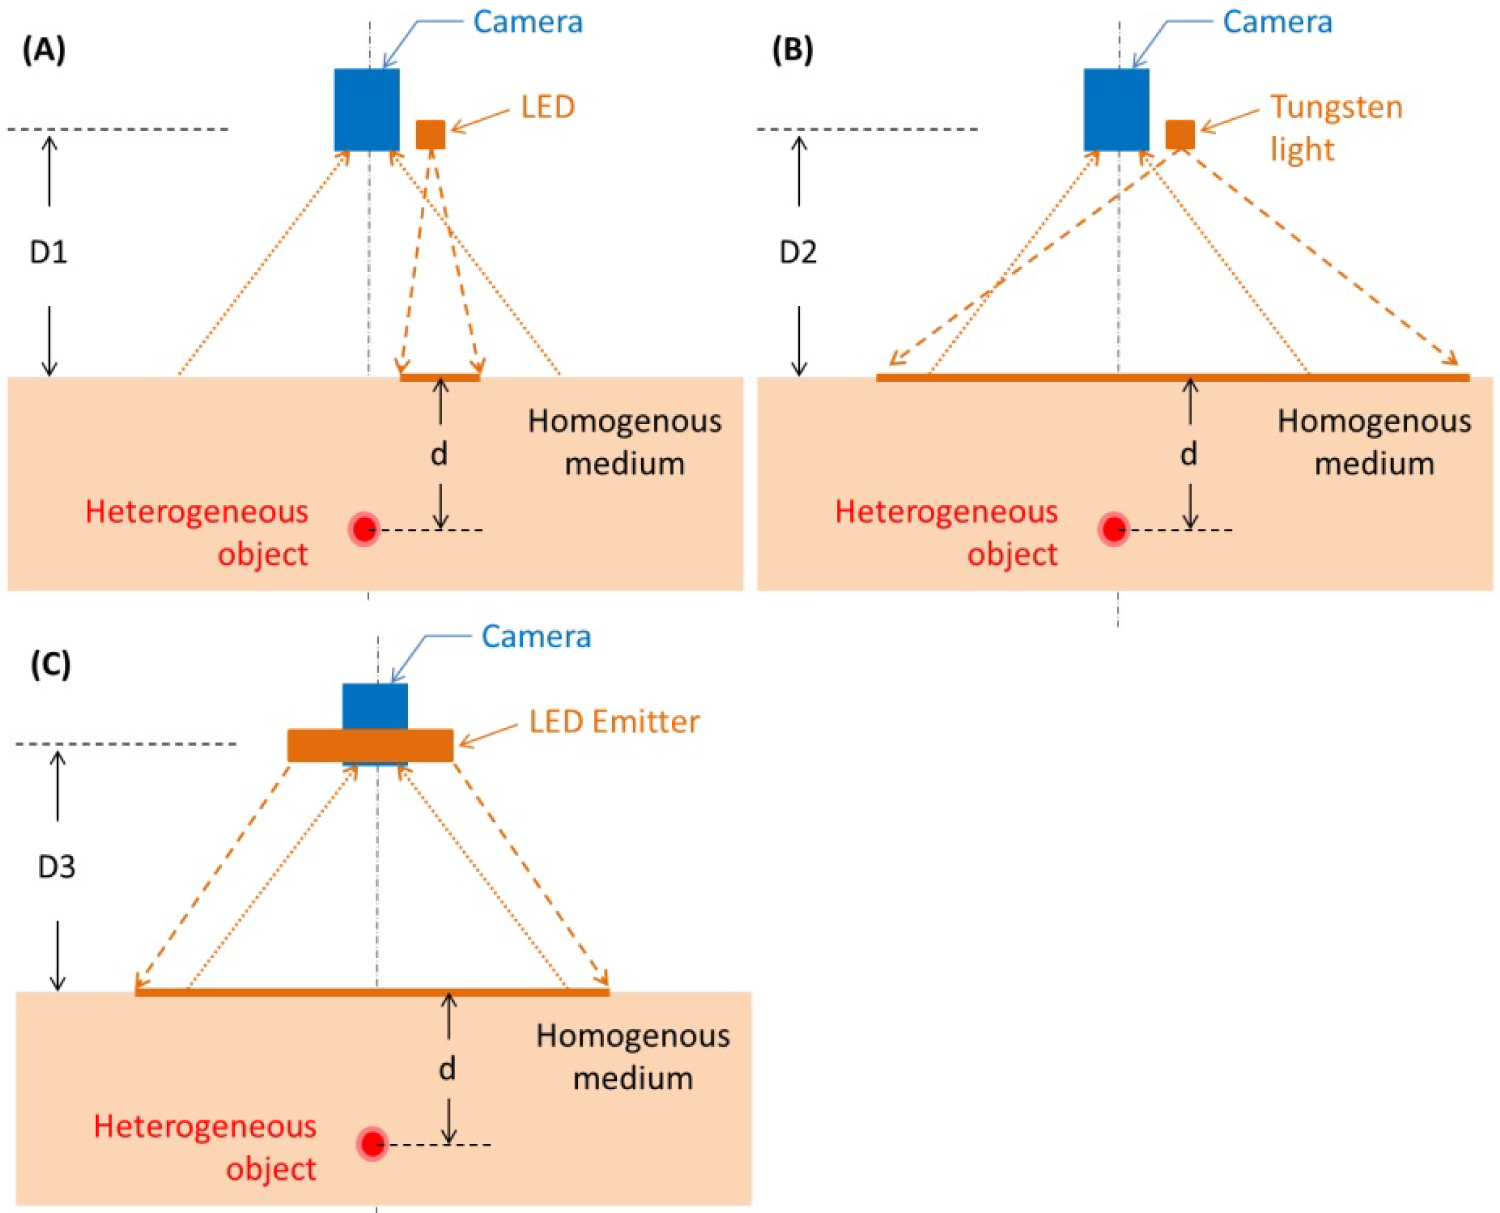
Figure 1: Bench top system shown in a...
Bench top system shown in a reflectance mode. The illumination configurations displayed are A) A single wavelength LED; B) A tungsten light bulb, and C) A high-powered LED array. The object under illumination is an imaging target embedded at depth = d, in the tissue phantom model.
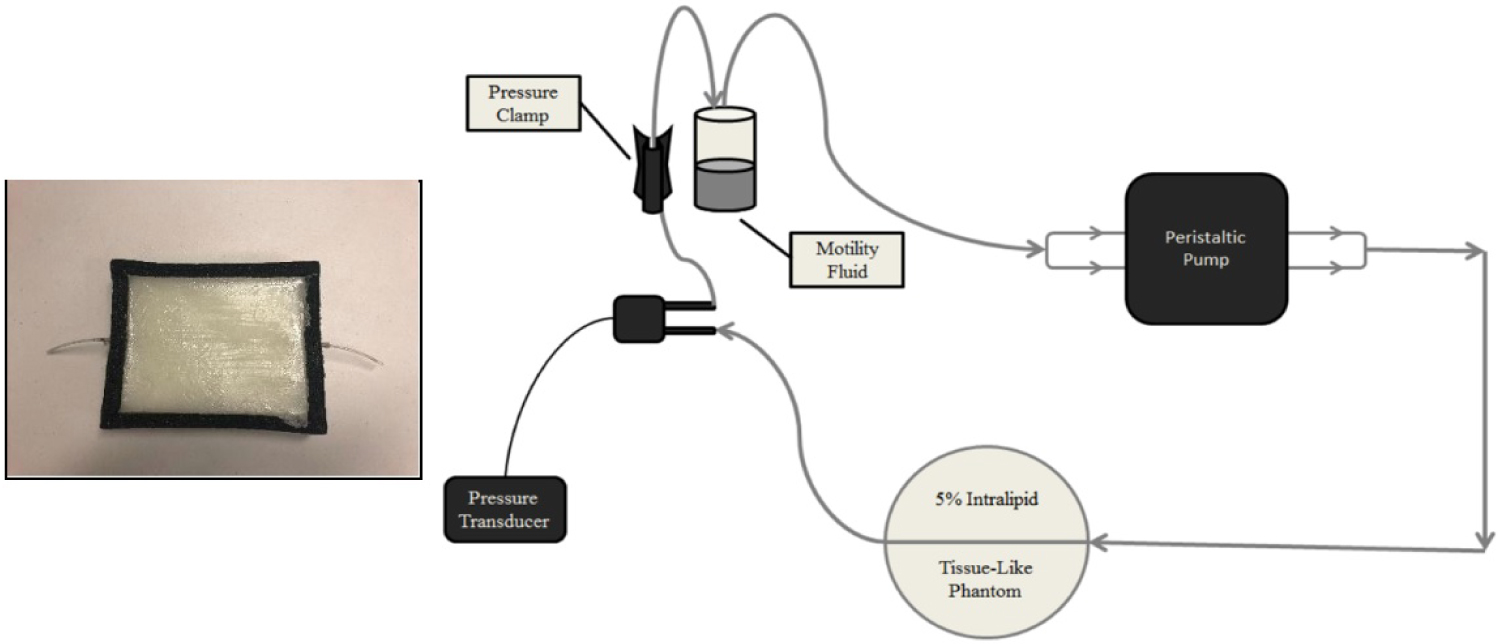
Figure 2: (Left) Tissue phantom in a black foam...
(Left) Tissue phantom in a black foam container with an elastic tube embedded in the homogeneous tissue matrix, which mimics the blood flow in tissue. (Right) Schematic of the apparatus designed to simulate human pulsatile blood flow in a laboratory setting. The peristaltic pump drives the motility fluid through an elastic phantom vessel, embedded in the gelatin-Intralipid tissue phantom matrix. Due to the elasticity of the tubing, a ~2% volume expansion in the phantom vessel, similar to that of human arteries, occurs with each cycle of the peristaltic pump.
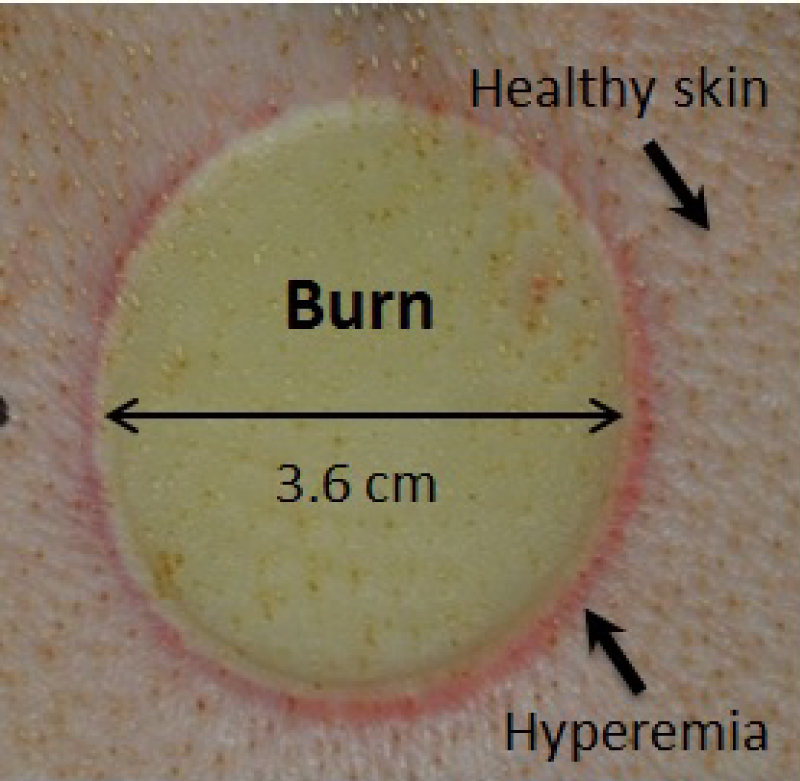
Figure 3: In-vivo thermal burn wound on a porcine...
In-vivo thermal burn wound on a porcine skin in a circular shape which served as the animal burn model.
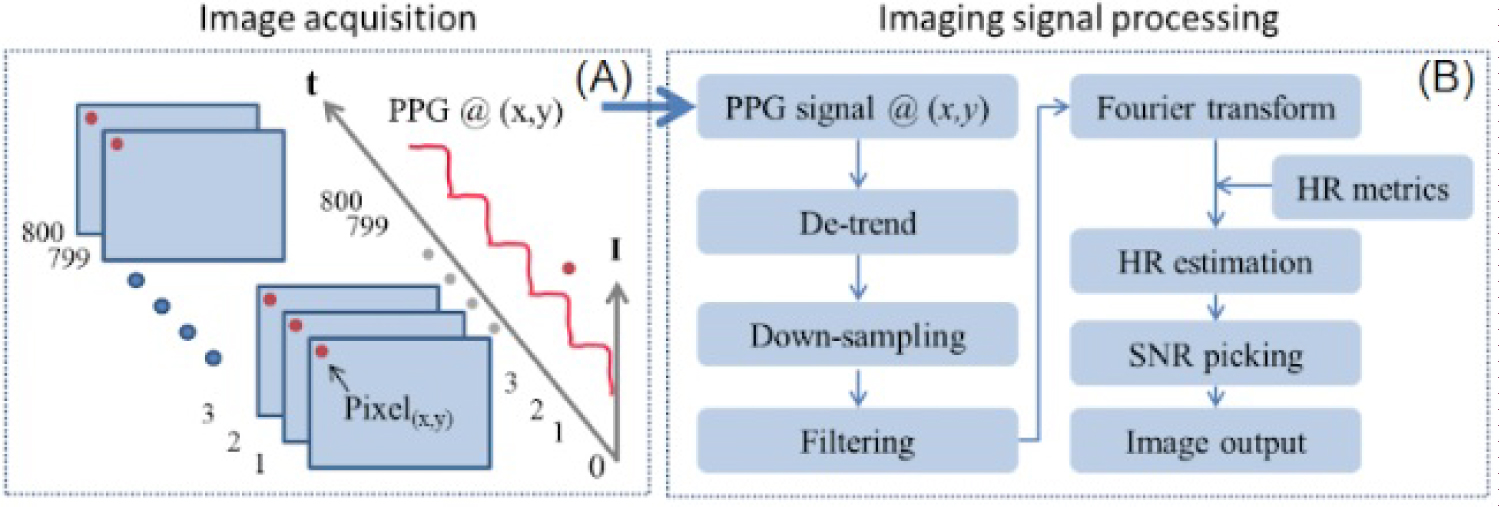
Figure 4: Time-resolved PPG signal extraction...
Time-resolved PPG signal extraction. A) Intensity at image pixel (x,y) is extracted sequentially from 800 contingent frames; B) Processing method for quantifying PPG signals.
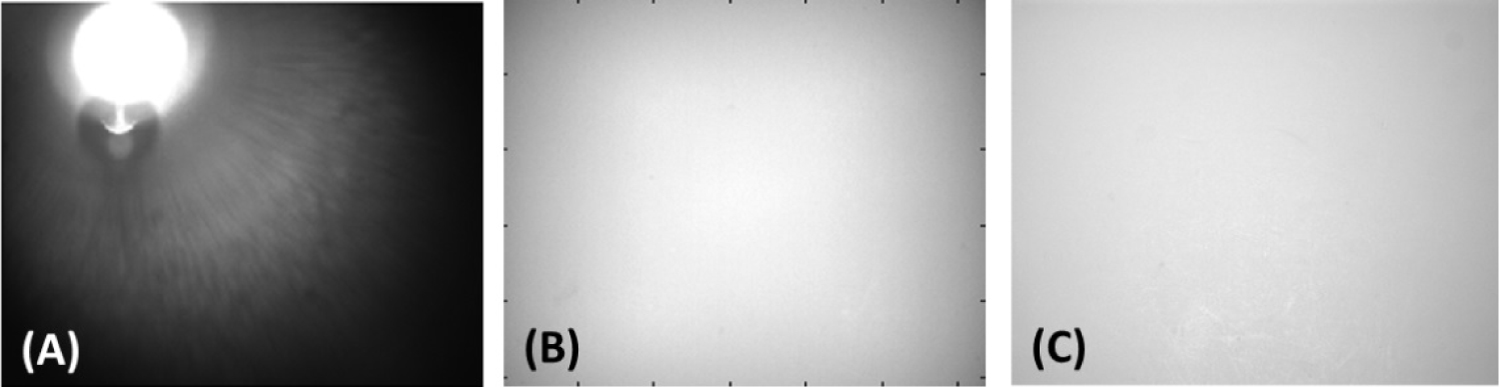
Figure 5: Comparison of spatial illumination...
Comparison of spatial illumination intensity between A) A single LED (non-uniform illumination); B) A tungsten light bulb (uniform illumination), and C) An LED array (improved uniform illumination) using Zenith Lite® as imaging target.
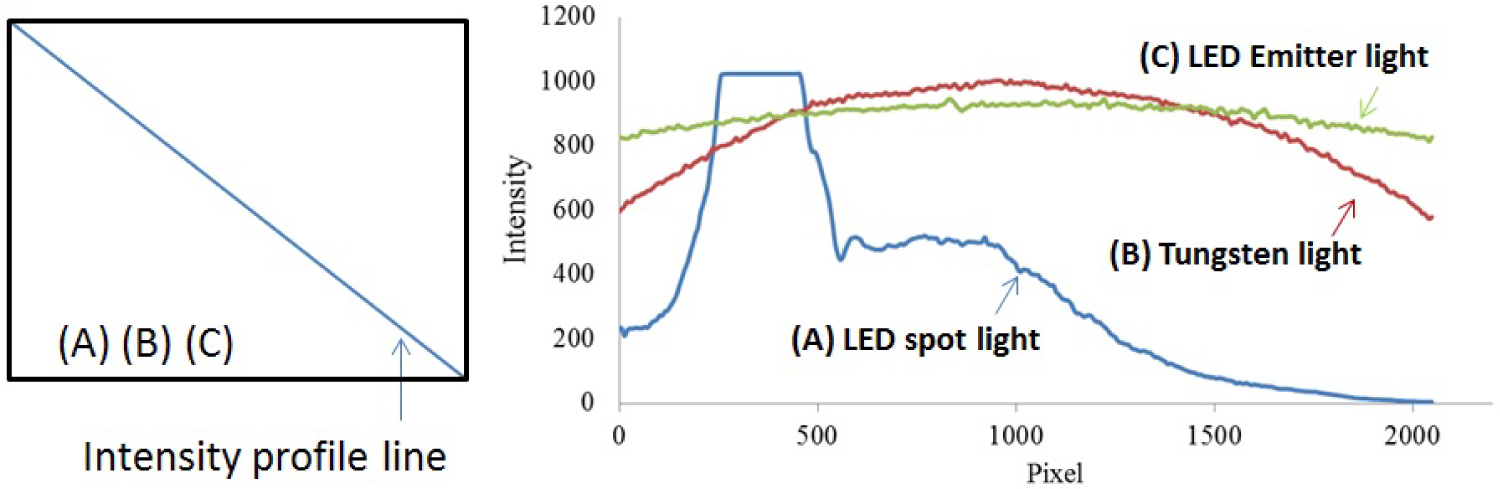
Figure 6: (Left) Pixels selected across the...
(Left) Pixels selected across the diagonal of each image used for comparison of intensity profiles between three illumination sources. (Right) The intensity profiles of A) A single LED (non-uniform illumination); B) A tungsten light bulb (uniform illumination), and C) an LED array (improved uniform illumination) using Zenith Lite® as imaging target are plotted.
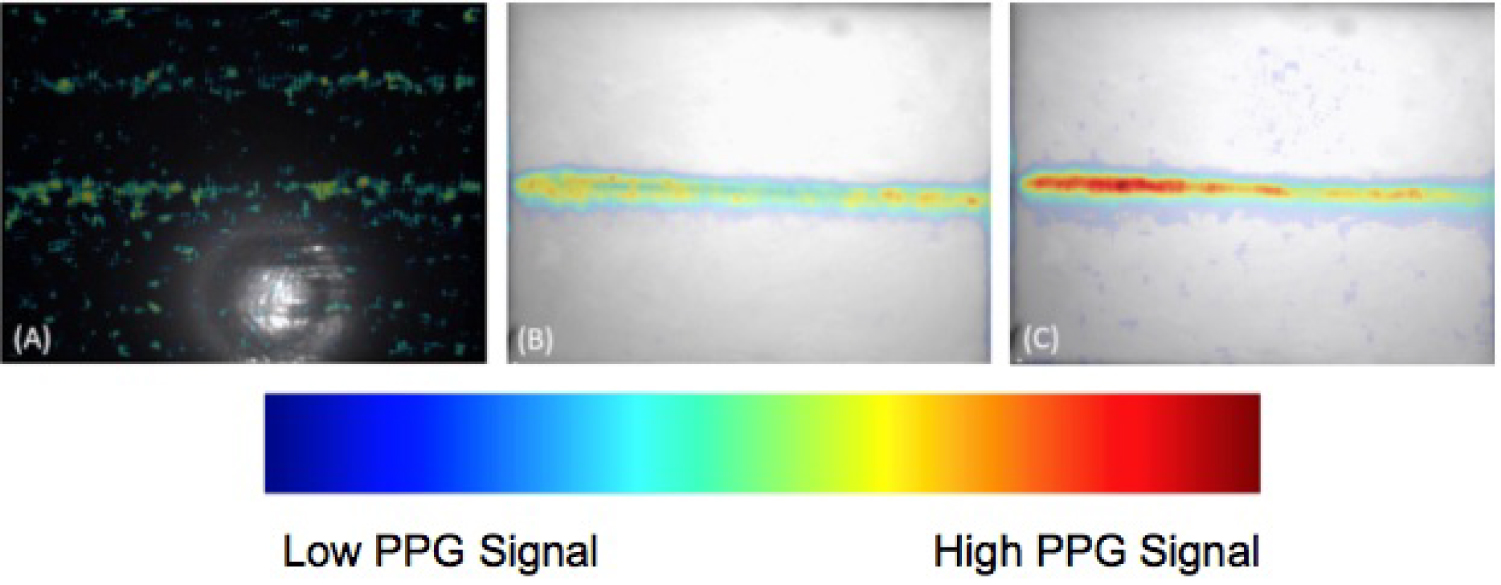
Figure 7: Imaging results of the gelatin-Intralipid...
Imaging results of the gelatin-Intralipid tissue phantom with an embedded pulsatile vessel using A) The single LED; B) the Tungsten light bulb, and C) The LED array, respectively. The PPG imaging results are overlaid with the image of the tissue phantom.
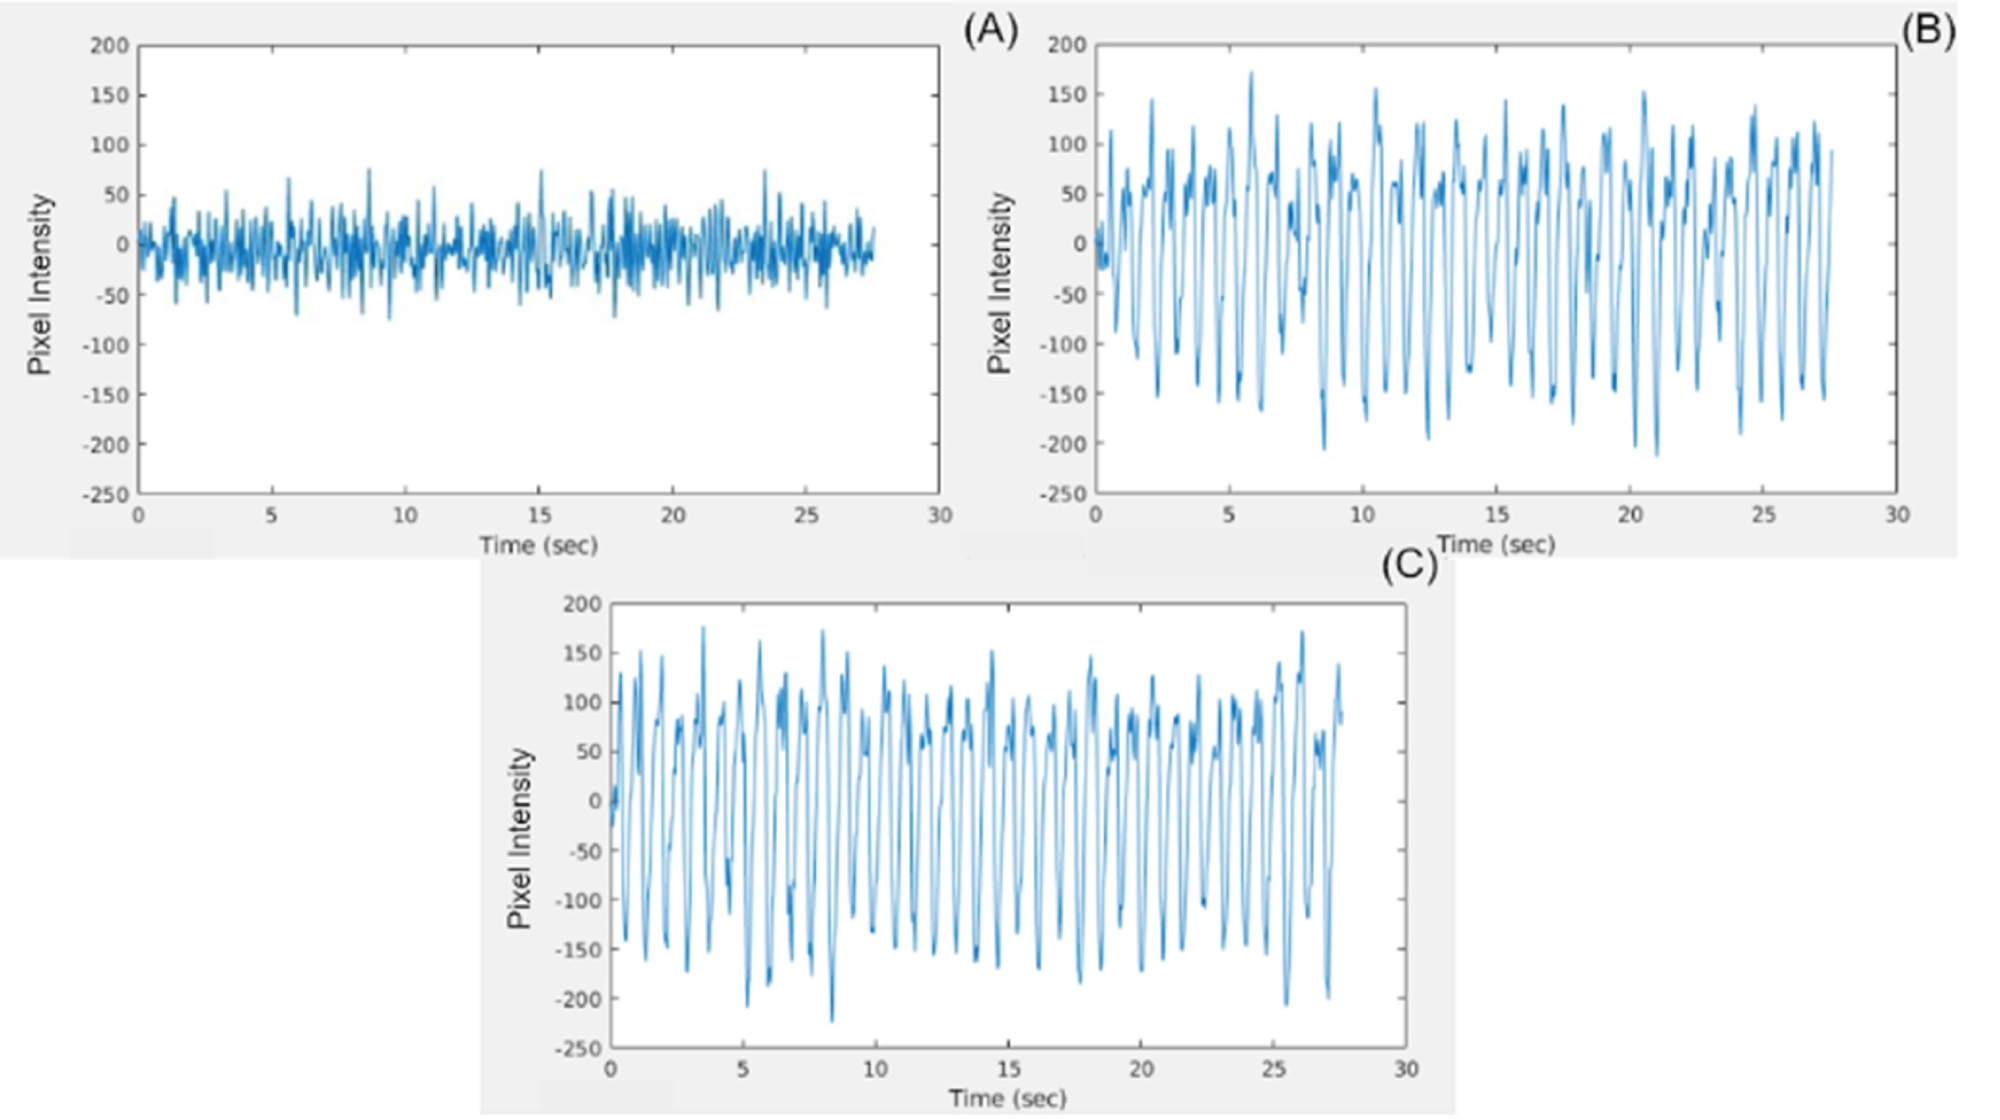
Figure 8: PPG waveform generated by plotting the...
PPG waveform generated by plotting the pixel intensity of a selected pixel from the highly pulsatile region of the tissue phantom over time for the A) The single LED; B) The Tungsten light bulb, and C) The LED array. Pixel intensity values span the range from -255 to +255.
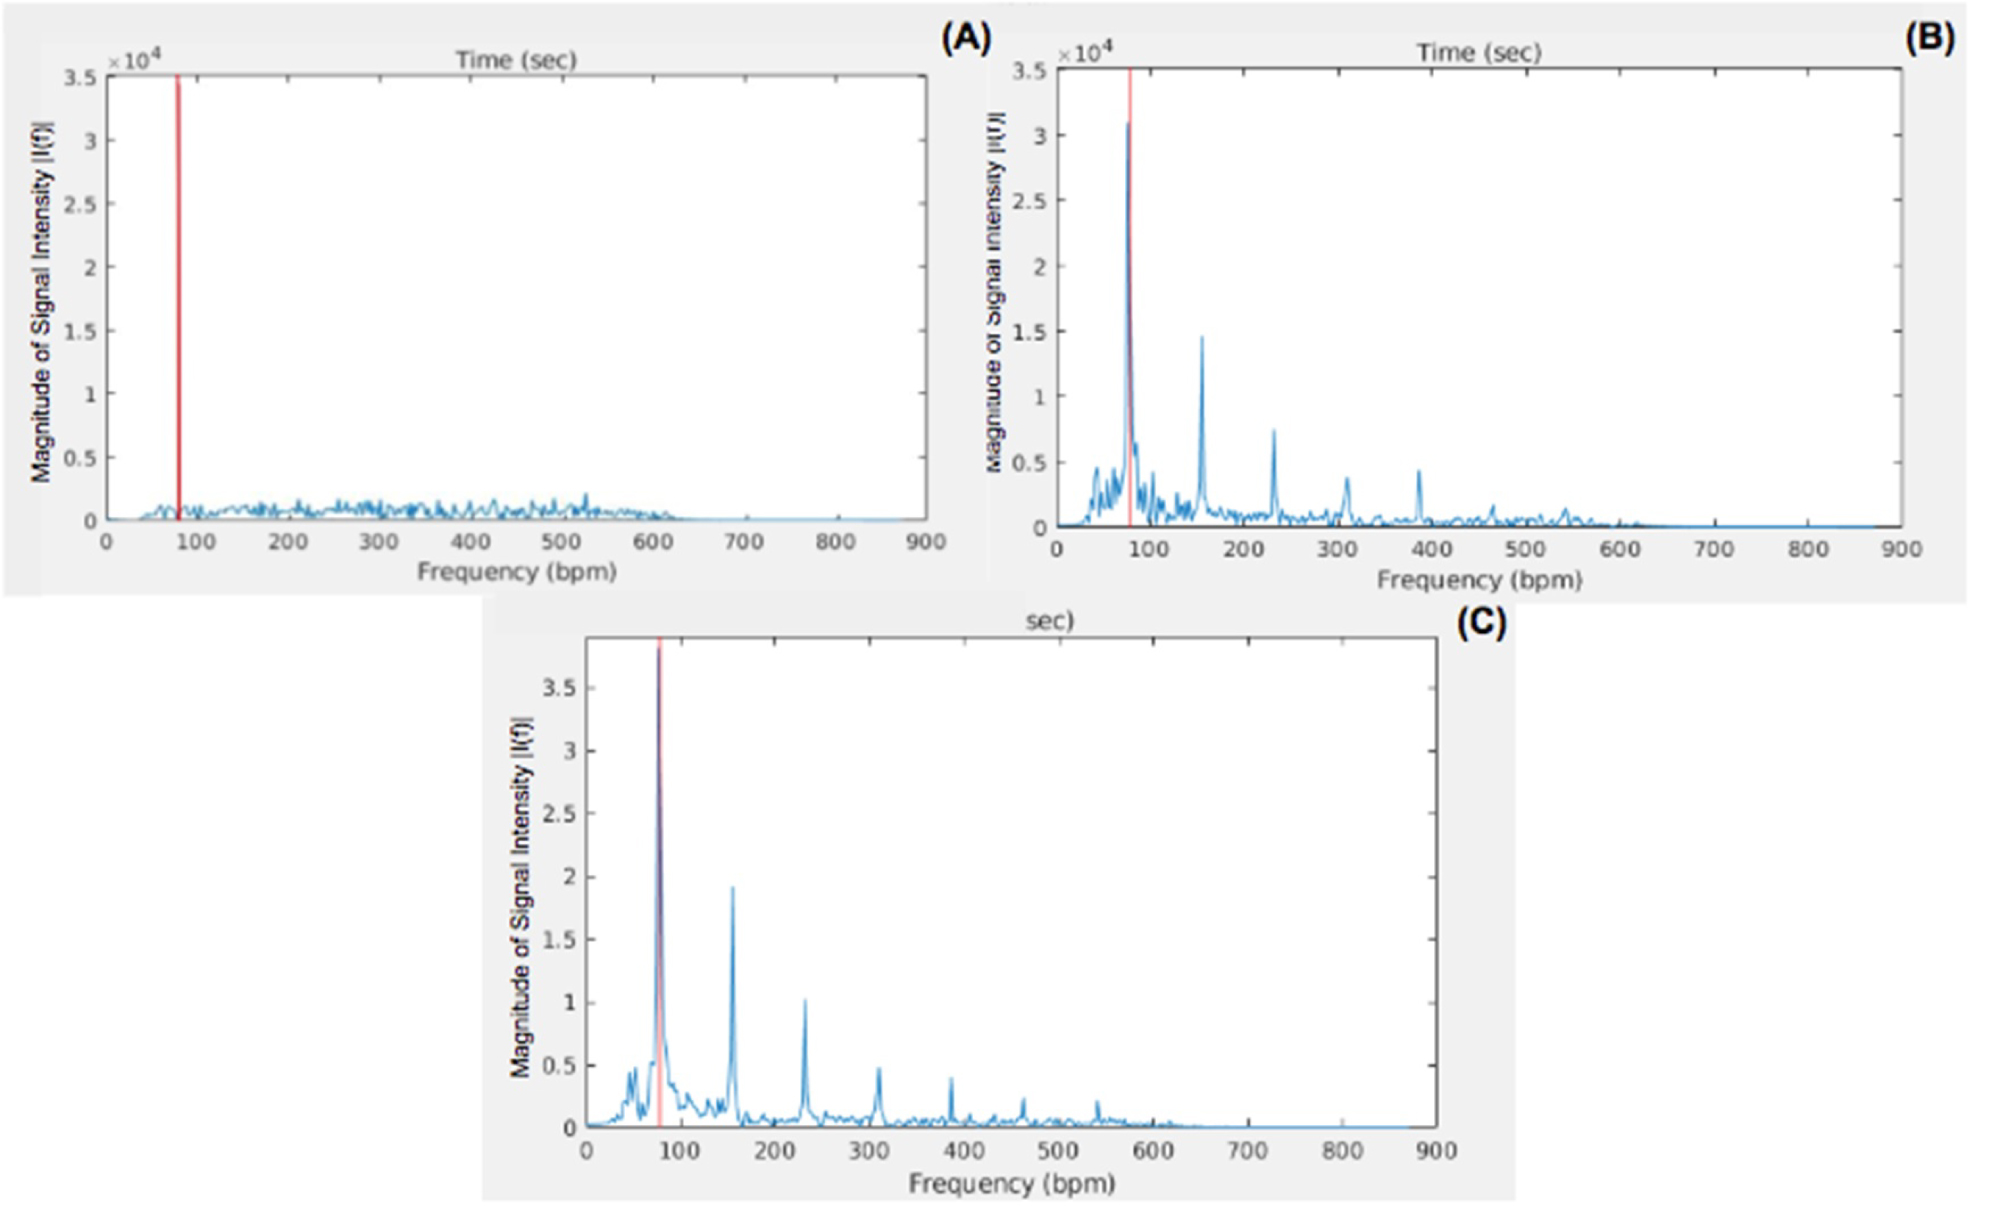
Figure 9: FFT of the PPG waveform plotted as...
FFT of the PPG waveform plotted as the magnitude of the intensity of a selected pixel from the highly pulsatile region of the tissue phantom plotted against frequencies for A) The single LED; B) The Tungsten light bulb, and C) The LED array. The red line signifies the estimated pulsatile frequency by each non-contact PPGI system.
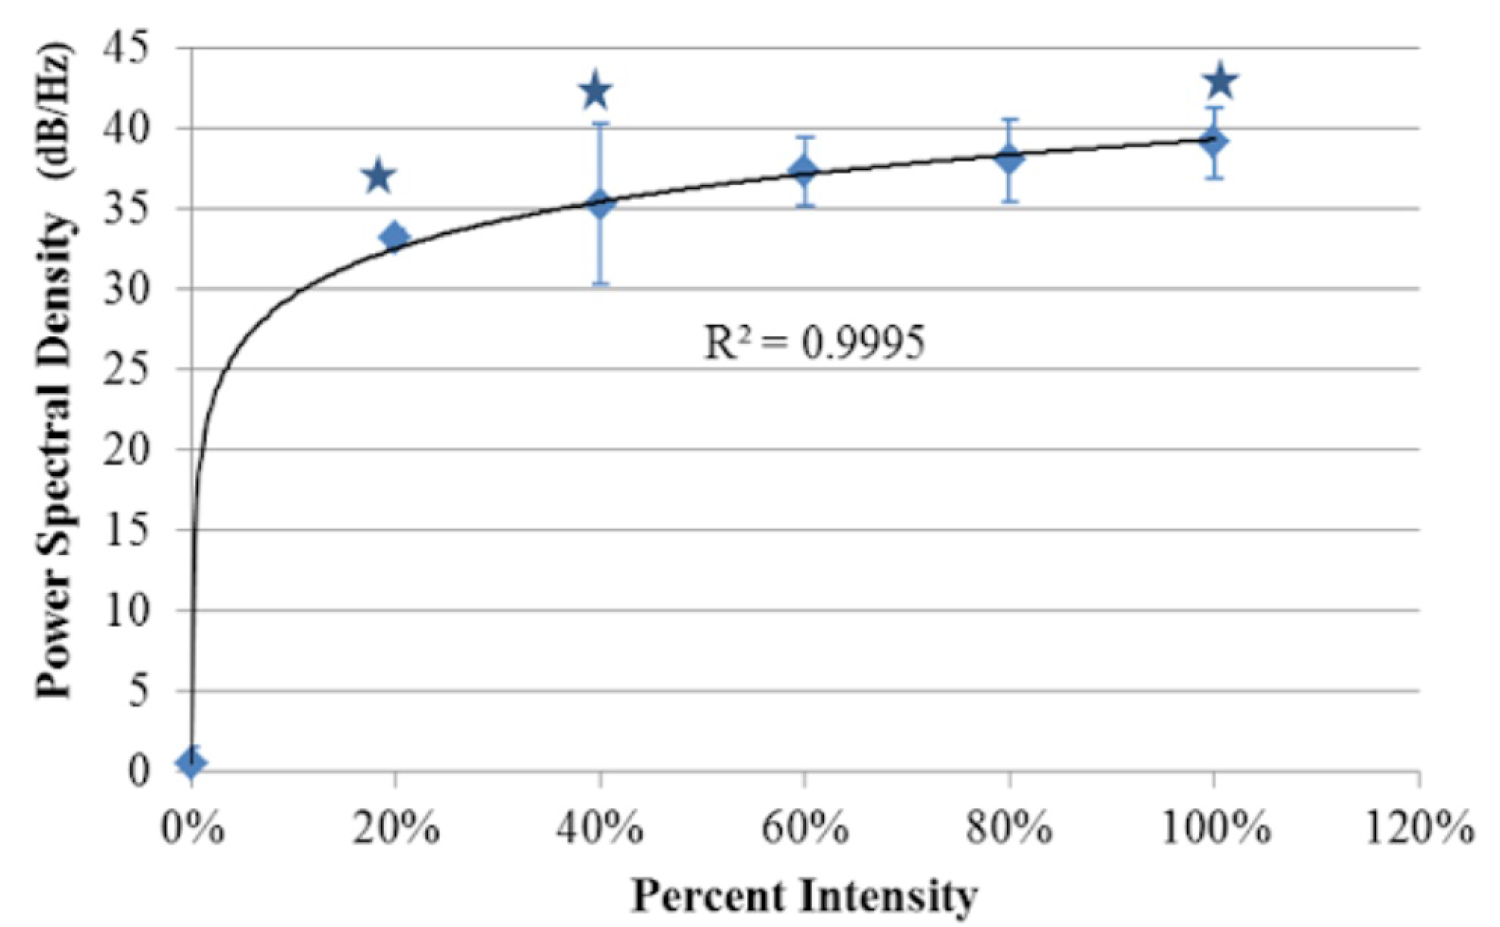
Figure 10: Relationship between the PPG signals' power...
Relationship between the PPG signals' power spectral density in the pulsatile region of the tissue phantom and the percentage of the maximum intensity of light from the LED array module (imager's max irradiance before saturation, 0.441 mW/cm2). Data points reflect an average of 5 pixels sampled from 3 tissue phantom replicates. Logarithmic Regression (R2 = 0.9995). Error bars represent standard deviation about the mean. (*) Denotes statistically significant as determined by one-way ANOVA (P < 0.05).
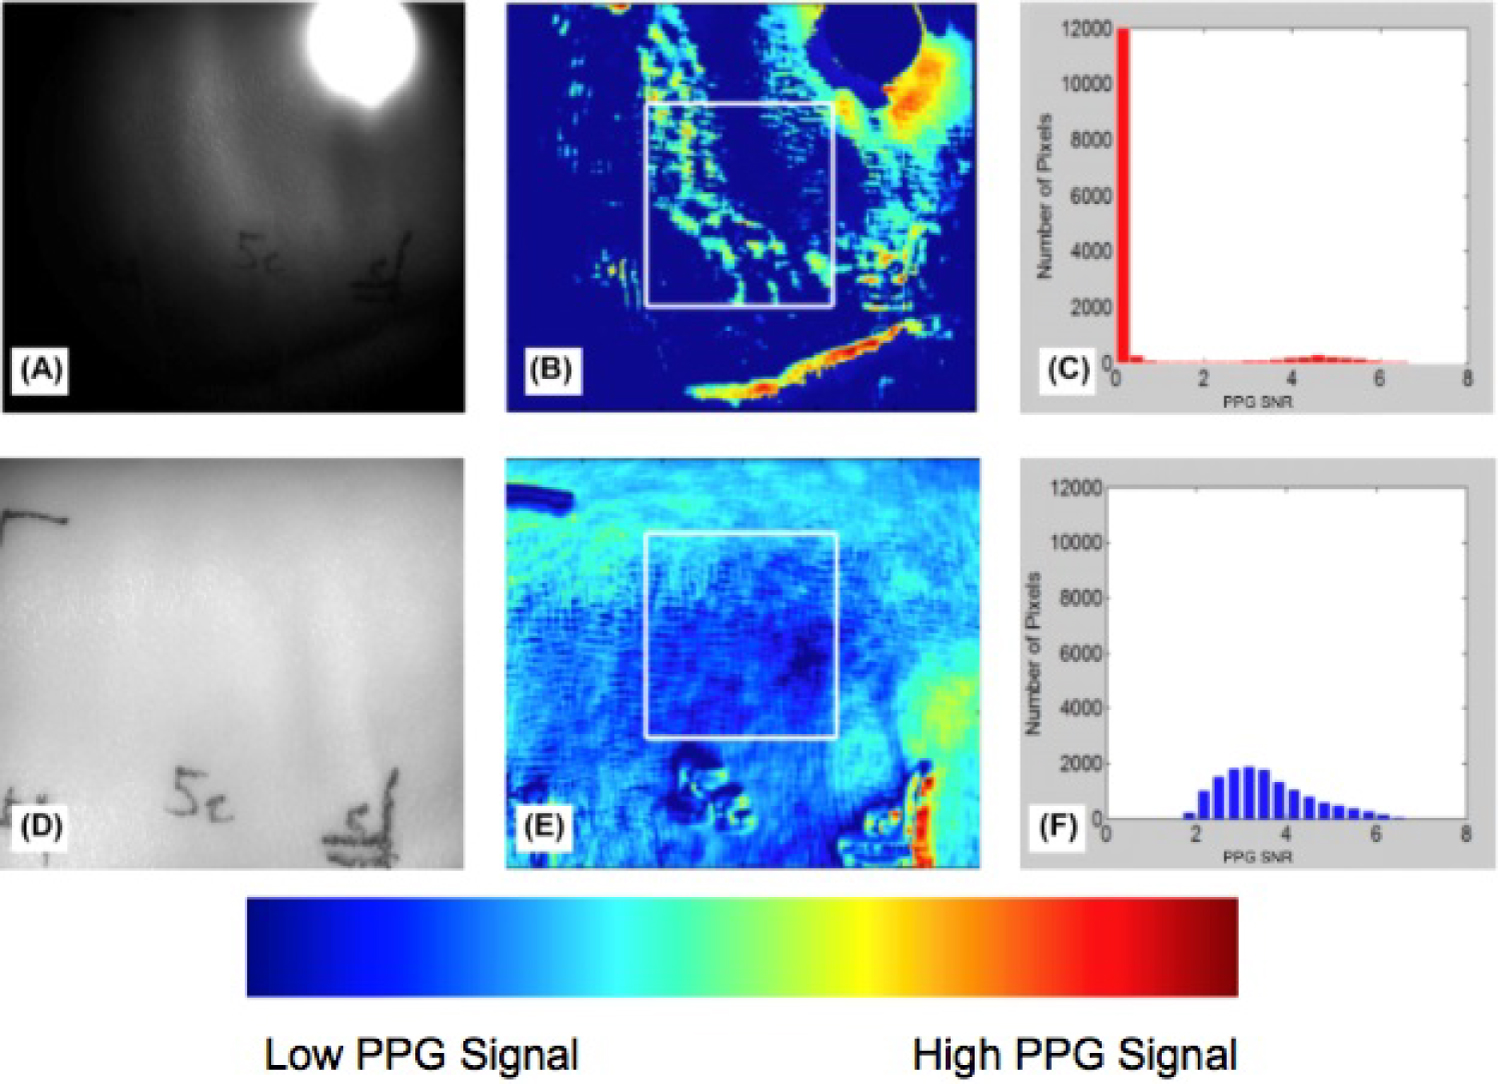
Figure 11: A,D) Grayscale image of normal porcine...
A,D) Grayscale image of normal porcine skin; B,E) Region of healthy porcine skin selected for analysis; C,F) Categorization of pixels based on PPG signal strength (PPG SNR). Top row are the results of the single LED, and the bottom row are the results of the LED array.
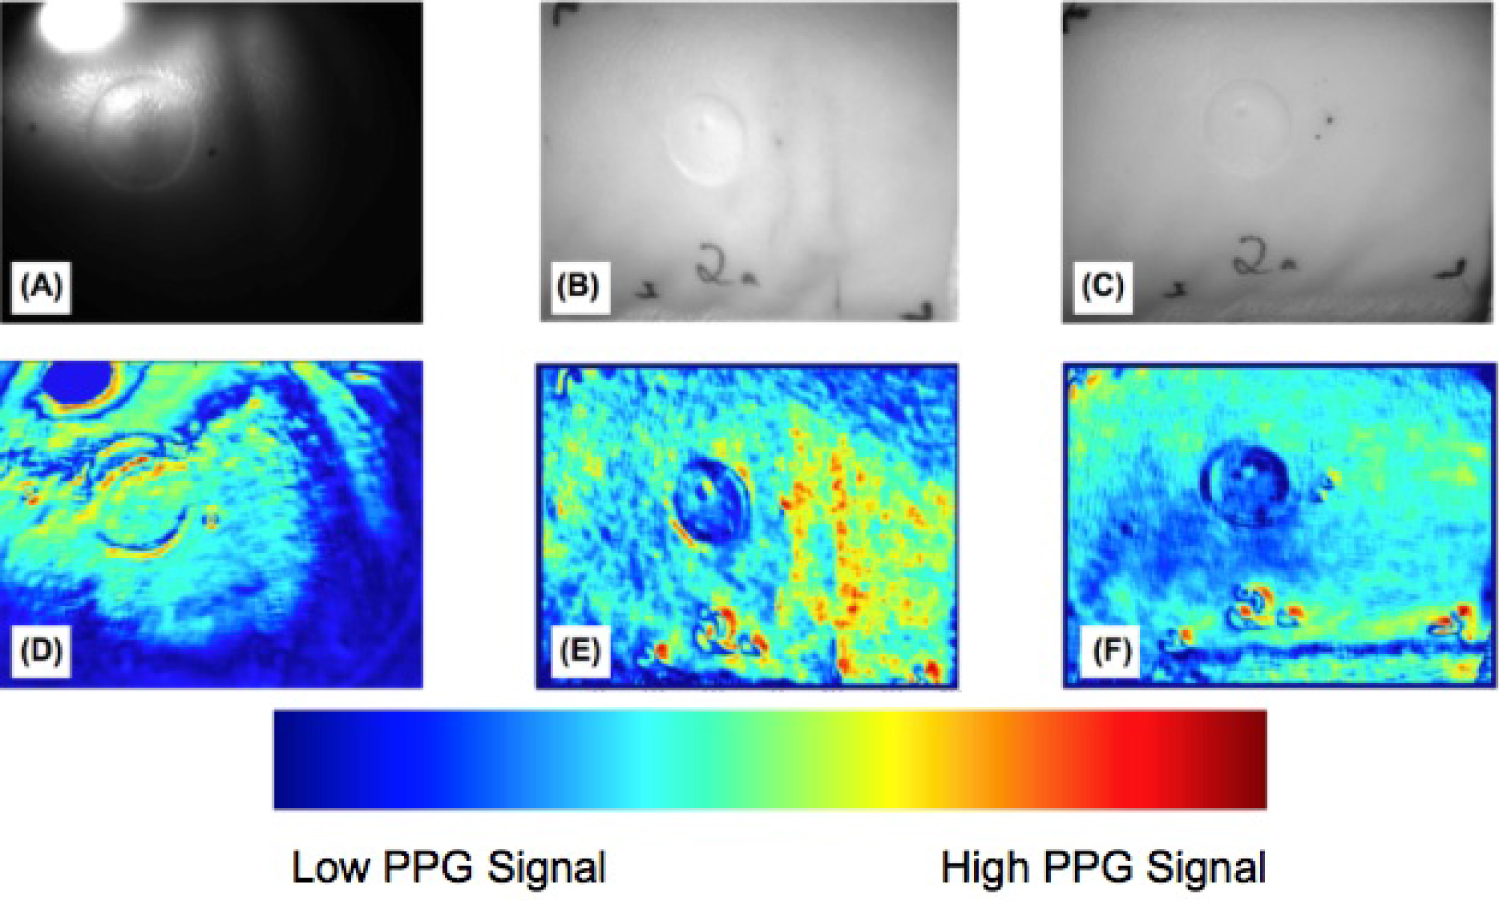
Figure 12: Comparison of the burn wound on pig...
Comparison of the burn wound on pig skin between illumination sources using A) The single LED; B) the Tungsten light bulb, and C) The LED array. The corresponding PPG outputs D-F) Show the performance of each system at differentiating the burn wound and healthy tissues.
Tables
Table 1: SNR values at the central pixel in the highly pulsatile region of the phantom tubing for each illumination source.
References
- Thatcher JE, Squiers JJ, Kanick SC, King DR, Lu Y, et al. (2016) Imaging techniques for clinical burn assessment with a focus on multispectral imaging. Adv Wound Care (New Rochelle) 5: 360-378.
- Devgan L, Bhat S, Aylward S, Spence RJ (2006) Modalities for the assessment of burn wound depth. J Burns Wounds 5: e2.
- King DR, Li W, Squiers JJ, Mohan R, Sellke EW, et al. (2015) Surgical wound debridement sequentially characterized in a porcine burn model with multispectral imaging. Burns 41: 1478-1487.
- Thatcher JE, Li W, Rodriguez-Vaqueiro Y, Squiers JJ, Mo W, et al. (2016) Multispectral and photoplethysmography optical imaging techniques identify important tissue characteristics in an animal model of tangential burn excision. J Burn Care Res 37: 38-52.
- Blazek V, Wu T, Hoelscher D (2000) Near-Infrared CCD imaging: Possibilities for noninvasive and contactless 2D mapping of dermal venous hemodynamics. The International Society for Optics and Photonics Proceedings 3923, Optical Diagnostics of Biological Fluids V.
- Huelsbusch M, Blazek V (2002) Contactless mapping for rhythmical phenomena in tissue perfusion using PPGI. The International Society for Optics and Photonics Proceedings 4683, Medical Imaging 2002: Physiology and Function from Multidimensional Images.
- Antonutto G, Girardis M, Tuniz D, di Prampero PE (1995) Noninvasive assessment of cardiac output from arterial pressure profiles during exercise. Eur J Appl Physiol Occup Physiol 72: 18-24.
- Alian AA, Shelley KH (2014) Photoplethysmography. Best Pract Res Clin Anaesthesiol 28: 395-406.
- Moza R, Dimaio JM, Melendez J (2010) Deep-tissue dynamic monitoring of decubitus ulcers: Wound care and assessment. IEEE Eng Med Biol Mag 29: 71-77.
- Nilsson LM (2013) Respiration signals from photoplethysmography. Anesth Analg 117: 859-865.
- Rundo F, Conoci S, Ortis A, Battiato S (2018) An advanced bio-inspired photoplethysmography (PPG) and ECG pattern recognition system for medical assessment. Sensors (Basel) 18: 405.
- Sun Y, Thakor N (2016) Photoplethysmography revisited: from contact to noncontact, from point to imaging. IEEE Trans Biomed Eng 63: 463-477.
- Webster JG (1997) Design of pulse oximeters. Institute of Physics Publishing, Medical Science Series.
- Moco AV, Stuijk S, de Haan G (2016) Motion robust PPG imaging through color channel mapping. Biomed Opt Express 7: 1737-1754.
- Cuccia DJ, Bevilacqua F, Durkin AJ, Tromberg BJ (2005) Modulated imaging: Quantitative analysis and tomography of turbid media in the spatial-frequency domain. Opt Lett 30: 1345-1356.
- Rundo F, Ortis A, Battiato S, Conoci S (2018) Advanced bio-inspired system for noninvasive cuff-less blood pressure estimation from physiological signal analysis. Computation 6.
- DeGrand AM, Lomnes SJ, Lee DS, Pietrzykowski M, Ohnishi S, et al. (2006) Tissue-like phantoms for near-infrared fluorescence imaging system assessment and the training of surgeons. J Biomed Opt 11: 014007.
- Khamdaeng T, Luo J, Vappou J, Terdtoon P, Konofagou EE (2012) Arterial stiffness identification of the human carotid artery using the stress-strain relationship in vivo. Ultrasonics 52: 402-411.
- Nwafor CI, Plant KD, King DR, McCall BP, Squiers JJ, et al. (2017) Assessment of a noninvasive optical photoplethysmography imaging device with dynamic tissue phantom models. J Biomed Opt 22: 1-9.
- Heredia-Juesas J, Thatcher JE, Lu Y, Squiers JJ, King D, et al. (2018) Burn-injured tissue detection for debridement surgery through the combination of non-invasive optical imaging techniques. Biomed Opt Express 9: 1809-1826.
- Branski LK, Mittermayr R, Herndon DN, Norbury WB, Masters Oscar E, et al. (2008) A porcine model of full-thickness burn, excision and skin autografting. Burns 34: 1119-1127.
- Middelkoop E, van den Bogaerdt AJ, Lamme EN, Hoekstra MJ, Brandsma K, et al. (2004) Porcine wound models for skin substitution and burn treatment. Biomaterials 25: 1559-1567.
- Spigulis J (2017) Multispectral, fluorescent and photoplethysmographic imaging for remote skin assessment. Sensors (Basel) 17: 1165.
Author Details
C Ikenna Nwafor1*, Weirong Mo1, Darlene R King1, Aadeesh Shringarpure1, Kevin D Plant1, John J Squiers1,2,3, Tobechukwu O Nwafor1, Ronald D Baxter1, Rachit Mohan1, Weizhi Li1, Xu Zhang1, Eric W Sellke1, Wensheng Fan1, J Michael DiMaio1,3 and Jeffrey E Thatcher1
1Spectral MD, Inc. Dallas, Texas, USA
2Department of Surgery, Baylor University Medical Center, Dallas, Texas, USA
3Baylor Research Institute, Baylor Scott and White Health, Dallas, Texas, USA
Corresponding author
C Ikenna Nwafor, Spectral MD, Inc., 2515 McKinney Ave. Ste. 1000, Dallas, TX 75201, Texas, USA
Accepted: May 08, 2019 | Published Online: May 10, 2019
Citation: Nwafor CI, Mo W, King DR, Shringarpure A, Plant KD, et al. (2019) Importance of Illumination in a Non-Contact Photoplethysmography Imaging System for Burn Wound Assessment. Int J Opt Photonic Eng 4:016.
Copyright: © 2019 Nwafor CI, et al. This is an open-access article distributed under the terms of the Creative Commons Attribution License, which permits unrestricted use, distribution, and reproduction in any medium, provided the original author and source are credited.
Abstract
Photoplethysmography imaging (PPGI) is an optical technique that assesses tissue blood perfusion and can assist in the identification of necrotic, non-viable tissue. We present a non-contact PPGI method and prototype system that could aid clinicians and surgeons by improving wound triage decisions and dermal wound management. We assessed features of the non-contact PPGI system and evaluated their impact on the system's ability to generate useful outputs that discern healthy, viable tissue from necrotic, burned tissue. Uniformity and intensity parameters of the illumination source were identified as key variables. They were tested in a controlled tissue phantom model and a porcine burn model under three illumination configurations: Single LED, Tungsten light bulb, and LED array. Maximization of illumination intensity for a given sensor allowed for accurate identification and acquisition of the pulsatile photoplethysmography (PPG) signal in both the tissue phantom and porcine burn models. Increased spatial uniformity from the illumination source also provided a substantial improvement in the quality of the image outputs generated by the non-contact PPGI system. These results simplify the illumination subsystem complexity, minimize the need for sophisticated cameras, and allow the PPG signal from different pixels to be comparable in both the time-domain and the frequency-domain. Due to the optical improvements of the non-contact PPGI system, clinically relevant images can be acquired that will aid physicians and surgeons in the management of burns and other similar wounds.
Keywords
Medical imaging, Non-invasive, Tissue phantom, Photoplethysmography, Infrared, Illumination, Imaging
Introduction
Although bedside clinical evaluation remains the current standard of care, optical imaging technologies have been explored as potential solutions for assisting clinicians with wound management and blood perfusion measurements [1]. Clinical evaluation takes time, requiring development and presentation of the wound before the clinician can make a judgement. This contributes to the reported accuracy rate of approximately 66% for the method [2].
Current technologies provide a quick, non-invasive method for superficial tissue assessment, and include color photography, thermography, laser Doppler imaging, indocyanine green video angiography (ICG), ultrasound (US), and nuclear imaging [3,4]. However, limitations of these technologies include susceptibility to ambient temperature, reduced field of view, and requirement for dye. These limitations can lead to low-utility information and make the technology difficult to adopt in the clinical setting. For this reason, novel optical technologies under development such as multispectral imaging (MSI) and photoplethysmography imaging (PPGI) have shown promise and continue to be explored [1,5,6].
PPGI provides a non-invasive method for assessing arterial blood flow that relies on the ability to detect tissue-volume changes owing to the pulsatile flow of blood in the arterial circulation. Conventional PPGI is a contact-based, transmissive modality; however, it does not allow for assessment of large areas of tissue [7]. Non-contact PPGI extends this ability by eliminating the need for patient contact and providing a larger field of view for assessment. The images generated provide clinicians with a method of assessing tissue perfusion, cardiovascular health [7,8], wounds [9], and respiratory health [10].
Non-contact PPGI systems typically consist of an illumination source and a low-light sensitive sensor (scientific CMOS or CCD cameras) [11]. Near-infrared (NIR) wavelengths are primarily used as the illumination source because of their increased penetration into tissue [12]. This penetration improves the chances for acquisition of signals from pulsing arterioles of the target tissue. The system configurations studied herein follow this practice by placing a NIR bandpass filter in the camera lens. Despite this well studied effect of tissue penetration by wavelength, there is little research on the illumination parameters other than wavelength that affect the system's ability to generate useful images.
The performance of non-contact PPGI systems is based on the ability of the imager to resolve the luminal volume change observed in arterial vessels [13]. Motion artifacts and low SNR, which are closely linked to the spatial frequency of illumination, are significant problems of current non-contact PPGI systems [14-16]. For this reason, we identified illumination intensity and spatial uniformity as key features for the performance of a non-contact PPGI system [14]. In this study, the effects of these parameters on the generated PPG outputs were explored. The hypothesis was that the strength and accuracy of the PPG signal can be enhanced by higher intensity and more uniform illumination of the imager's entire field-of-view (FOV). We first characterized the uniformity and intensity of the various illumination sources. We then evaluated the ability of the non-contact PPGI systems to discern pulsatile blood flow in both tissue phantom and animal models.
Materials and Methods
Non-contact PPGI System
The non-contact PPGI system consisted of three functional modules: The illumination source, the sensor, and the imaging target. The illumination source and the sensor were placed on the same side relative to the imaging target, in a reflectance mode (Figure 1). The optical beam incident on the object scattered into the target, and the camera captured the back-scattered optical signals. Three different illumination sources were used: 1) A single 850 nm light emitting diode (LED), 2) A broad spectral tungsten light bulb, and 3) A high-powered 850 nm LED array. The three illumination sources were powered by a highly stable power supply (TP3003D-3, Tekpower, Montclair, California, United States).
Camera: A monochromatic camera (BM-141GE, JAI Inc., San Jose, California, United States) was used as the sensor, which provided low dark noise, dynamic range, and acquisition speed of 30 frames per second using a rolling shutter. A custom 855 nm (+/- 25 nm) optical band-pass filter (PixelTeq, Largo, Florida, United States) was placed between the sensor and the lens to ensure the same spectral bandwidth was collected between the different illumination sources. The 10-bit ADC resolution offered a signal-to-noise ratio of 58 dB. The camera was mounted vertically, facing down towards the surface of the imaging target. The acquired images were cropped down to 1408 × 1044 pixels as a control for inter-system comparison. The exposure times of the camera in each system were calibrated with a 95% diffuse reflectance panel (Zenith Lite® SG3151, LabSphere Inc., North Sutton, New Hampshire, United States) to compensate for the differences in spectral response between the non-contact PPGI systems and no cross polarization was used.
Single LED: The 850 nm single LED (KCL-5230H, Kodenshi America, San Diego, California, United States) was mounted near the sensor at a distance D1 = 18 cm from the surface of the imaging target (Figure 1A). The lens casing contained a lens that diffused the emitted light, more uniformly illuminating the imaging target.
Tungsten: The tungsten light bulb (ViP Pro-light, Lowel Inc., Hauppauge, New York, United States) was mounted adjacent to the sensor at a distance D2 = 60 cm from the surface of the imaging target (Figure 1B). Two pieces of frosted glass diffuser (iP-50, Lowel Inc., Hauppauge, New York, United States) were mounted in front of the illumination source to reduce the projection directivity and more uniformly illuminate the imaging target.
LED Array: The high-powered 850 nm LEDs (SFH 4740, OSRAM, Munich, Germany) were positioned in a 2 × 2 array and mounted coaxially to the sensor at a distance D3 = 30 cm from the surface of the imaging target (Figure 1C). There was one piece of polycarbonate diffuser (65890, Edmund Optics, Barrington, New Jersey, United States) placed in front of each LED component of the array.
Tissue phantom
The tissue phantom model was designed to mimic human arterial blood flow beneath the skin surface (Figure 2) and adapted from the methods of DeGrand, et al. [17]. Type B Gelatin (2124, JT Baker, Center Valley, Pennsylvania, United States) in 10% w/v pH 7.4 Tris-buffered saline (J60764, Alfa Aesar, Haverhill, Massachusetts, United States) was mixed with 20% w/v sterile Intralipid fat emulsion (BHL2B6063H, Baxter International, Deerfield, Illinois, United States). In addition, 0.2% total volume of the motility standard was added to the gelatin matrix to mimic the blood volume found in tissue and more closely replicate the absorptive property of tissue [9 - Nwafor]. Motility standard was comprised of 0.2% w/v 100 nm polystyrene beads (43302, Sigma Aldrich, St. Louis, Missouri, United States) and 0.1% w/v India ink (44021, Higgins, Leeds, Massachusetts, United States) mixed with deionized water (6442, Sigma Aldrich, St. Louis, Missouri, United States).
The mixture was poured into a black, foam container with 15 cm × 12 cm area and 3 cm depth. This formed an opaque, light-absorbing, homogeneous container which prevented light from reflecting off the surfaces and being captured by the imaging sensor. Using a light-dependent resistor (GM5539, eBoot, Seattle, Washington, United States), we experimentally determined that at a depth of 3 cm, light from the imaging systems did not reach the bottom surface of the tissue phantom. Therefore, it did not pose any issues related to reflected light from that surface.
Silastic tubing (60-011-07, Dow-Corning, Midland, Michigan, United States) with inner diameter 1.58 mm was placed at a depth d = 8 mm beneath the surface. Silastic tubing was selected because it allowed for mimicking of the volumetric changes experienced during arterial blood flow and demonstrated similar elasticity to that of human arterial vessels with Young's module of 2.1 MPa at 200% elongation [18]. During each pump cycle, the inner diameter of the Silastic tubing expanded by 2%, which mimicked the diameter change of peripheral arteries during the cardiac cycle. Nwafor, et al. showed that a pressure of 150 mmHg generated the 2% diameter changed needed to replicate arterial vessel expansion [19]. Pulse pressure was measured using a digital pressure transducer (Model# 60-3002, Serial# A-49918, Harvard Apparatus, Holliston, Massachusetts, United States) and calibrated against Dwyer Series 490 digital manometer.
To simulate the pulsatile nature of the cardiac cycle, the motility standard inside the tube was pumped by a two-roller peristaltic pump (sciQ32, Watson Marlow, Wilmington, Massachusetts, United States), which mimicked normal human heart rate of 80 BPM (Figure 2). This pulsatile flow through the vessel generated a PPG signal that was measurable by the non-contact PPGI systems.
Power spectral density assessment: A bench test was conducted using the pulsatile tissue phantom in conjunction with the high-powered LED array under varying incident light intensity conditions. By varying the voltage input to the LED array, the illumination intensity could be varied up to a saturation point that represented the maximum absolute irradiance the imager could resolve accurately. This saturation point occurred with an input voltage of 13.0 V to the LED array, corresponding to an absolute irradiance value of 0.441 mW/cm2. This irradiance value was quantified using a spectrometer (USB2000+, OceanOptics, Largo, Florida, United States). This saturation point was used as a reference to establish intensity thresholds in increments of 20% of that maximum. At each of the illumination levels from 0% to 100%, images were acquired and processed according to the methods of Heredia-Juesas, et al. which are described in the signal processing section of this manuscript [20].
Using the information from the processed image, the central pixel was selected manually from the highly pulsatile region along the tissue phantom tubing. This selected pixel was extracted and individually processed to determine the power spectral density (PSD), a measure of the signal power or energy at a particular frequency. The PSD at the pulsatile frequency of the tissue phantom, which mimicked human heart rate, was the subject of this investigation. This process was repeated five times across three different tissue phantoms to create a sampling, and the PSD values were averaged. These PSD values were then plotted with respect to the light intensity levels in terms of percentages.
Animal burn model
The methods used in this porcine burn model were modified from King, et al. [3]. Hanford swine were selected for the animal model, because of their skin's anatomical similarity to human skin. The thickness of pig's epidermis is 30-140 µm, which approximates the thickness of human epidermis at 50-120 µm [21]. In addition, the vascular structure and extracellular matrix composition of pig skin resembles that of human skin [22]. The animal was cared for as outlined in the Public Health Services (PHS) Policy on Humane Care and Use of Laboratory Animals. The procedure was performed in a fully equipped large animal surgical suite. The burn model and study protocol were approved by the Institutional Animal Care and Use Committee (IACUC).
The investigation began by first assessing the perfusion in normal, unburned tissue, using the single LED and LED array non-contact PPGI systems. A section of normal tissue was ideal as a control and selected because arterial blood flow could be assumed to be uniform throughout. Healthy tissue was readily available in large areas on the back of the pig, and the arterial blood flow occurring in this tissue was likely to be similar at any point on the pig's back.
Following image acquisition of the healthy unburned tissue, necrotic burned tissue was acquired with all three non-contact PPGI systems. Thermal burn wounds were prepared using a brass rod with controlled temperature and pressure. The rod was heated to 100 degrees Celsius in an oven, and then pressed to the skin on pig's dorsum at a pressure of 0.2 kg/cm2 for 60 seconds. This method created deep partial-thickness burns [22]. Wound sites contained one 3.6 cm diameter deep partial-thickness burn (Figure 3).
Signal processing
The signal processing methods for the experiments were adapted from those of Heredia-Juesas, et al. and are depicted schematically in Figure 4 [20]. For each image acquisition, a sequence of 800 images at a frame rate of 30 frames-per-second were acquired and stored as uncompressed TIFF files.
The time-varying PPG signal intensity was then calculated on a pixel-by-pixel basis. The key steps for PPG signal and image processing are as follows: 1) Linear detrending to remove the DC wandering; 2) Down-sampling in time-domain to reduce the data volume via spatial averaging of all frames; 3) Band pass filtering of the signal over a predefined range of frequencies where the pulsatile frequency is expected; and 4) Application of a fast Fourier transformation (FFT) converting time-resolved signal to frequency-domain. Following this step, four key features that differentiate high PPG signal from low PPG signal are extracted and they are listed below.
i. Signal to noise ratio (SNR)
ii. Maximum signal amplitude over its mean
iii. Number of standard deviations away from the mean; and
iv. Number of times the signal crosses over one half of its maximum value
From here, (5) The four features are used as inputs for the linear discriminant analysis (LDA) which calculates a vessel probability mask. The pixels within the mask have high PPG signals and are used as measures of the phantom pulsatile frequency. (6) This pulsatile frequency value is then used to calculate the relative strength of the PPG signal for each pixel in the image. (7) A color map of all the pixels within an image is then generated which yields the PPG image output. The colors were mapped from lowest to highest PPG signal within a single image. Signal processing was conducted with MATLAB (Version 2014a, MathWorks, Inc., USA). Outputs of signal processing that were used in the analysis of the non-contact PPGI systems included the 2D colormap output, the intensity waveform of the central pixel in the highly pulsatile region of the tissue phantom over time, and the magnitude of the FFT of this same pixel.
Results
Assessment of illumination uniformity
The observed illumination patterns varied between the three illumination sources. For the single LED configuration (Figure 5A), there was a bright spotlight within the FOV, which showed a high-intensity area surrounded by regions that became darker with distance from the source. The use of a single LED also introduced a slight shadow on the target, which was due to the presence of the LED enclosure structure. The LED enclosure contained a lens to diffuse the light emitted and create a more uniform illumination. In reality, the presence of the shadow further reduced the uniformity of the single LED. With the Tungsten light (Figure 5B), the illumination pattern was more uniform than that of the single LED, and the shadow effect was removed from the FOV. With the LED array (Figure 5C), the least amount of variation in illumination intensity was observed.
To assess the distribution of light throughout the entire illumination area, we placed the diffuse reflectance panel directly under the three non-contact PPGI systems and acquired images. Using the intensity profile line from PixelTeq software, we were able to plot the intensity values across the diagonal of the illumination area from each non-contact PPGI system. The diagonal intensity profile line crossing these three illumination sources highlighted the intensity variation between them. The FOV of the single LED had to request the full range of the camera (10-bit, intensity values from 0-1024) to contain the slight saturation of the spotlight area (plateau), the surrounding dimmed area (shoulder), and the less useful dark area (Figure 6). The slight saturation present in the single LED case was due to an effort to ensure that all pixels had some form of illumination and were not dark, therefore a small number of pixels in the spotlight contained saturation. The tungsten light and LED array improved the spatial uniformity across the FOV, which could reduce the need for dynamic range cameras. The spatial variation for the LED array was controlled and shown to be less than 12% while the temporal variation was less than 1%.
Tissue phantom results
The objective was to study the effect of each illumination source on the observed PPG signal in a carefully controlled bench test. The pulsatile tissue phantom was placed directly below the non-contact PPGI systems and images were collected then processed. The PPG outputs were compared to the direct measurement of pulsatility by the sensor to assess the effect of the illumination sources on the outputs obtained.
Overall the position of the vessel could not be resolved in the single LED case (Figure 7A), since there was a residual PPG signal present towards the upper portion of the image that mirrored that of the embedded vessel. In addition, there were small areas of PPG single scattered throughout the image, due to the uneven illumination and weaker intensity present on the periphery of the imaging target. For the tungsten light (Figure 7B), the incident beam was directed slightly away from the axis of the camera to prevent specular reflection across the entire FOV, which created a small incident angle. The directivity of the tungsten light bulb then induced areas of specular reflection on portions of the phantom surface. This effect saturated some pixels, weakening the detection of PPG signal. The color output in the imaging results however was strong and the position of the vessel within the tissue phantom could still be discerned. During image acquisition, the mostly infrared light emitted from the Tungsten source also generated a large amount of heat within the object, which denatured the gelatinous tissue phantom. The temperature of the imaging surface increased quickly from a room temperature of ~20 degrees Celsius to 30 - 40 degree Celsius in 30 minutes.
For the high-powered LED array (Figure 7C), the color output in the imaging results was strong and the width remained constant. There were few areas of mismatched PPG signal and the position of the PPG signals aligned with the actual position of the phantom vessel. The image contrast was also improved, which demonstrated the image quality was better than that of both the Tungsten light and the single LED. There was no thermal energy accumulated within the phantom, and the temperature change within 30 minutes was negligible at less than 0.1 C.
To understand the relationship between the pulsatile flow, SNR, and 2D color map, the central pixel in the highly pulsatile region of each PPG output was analyzed further. The PPG waveform for each pixel was plotted over time, then the FFT was computed and the magnitude of the signal intensity was plotted across frequencies. The full magnitude of the pulsatile pressure wave was not accurately measured by the single LED non-contact PPGI system, showing diminished amplitudes for the waveform. The oscillations were irregular and did not show what would be expected from a PPG signal (Figure 8A). In the frequency domain, there was no clearly identifiable signal and the signal intensity appeared constant across the range of frequencies (Figure 9A). The imaging system also had difficulty identifying the correct value for the pulsatile frequency, with an estimation of 179 BPM shown via the redline. This highlighted the inability of the single LED non-contact PPGI system to identify the PPG signal accurately within the tissue phantom and display a useful PPG output.
On the other hand, the systems using the tungsten and LED array illumination sources were able to identify clear, strong PPG waveforms with consistent amplitudes that resembled the expected PPG signals from a pulsatile target (Figure 8B and Figure 8C). Evaluating the FFT, the tungsten and LED array illumination sources are able to clearly identify distinct signals in the selected pixels. The systems' identification of the pulsatile frequency was more accurate, shown by the redline at 78 BPM, with additional peaks present at all subsequent harmonics of the frequency (Figure 9B and Figure 9C).
The SNR values give rise to the 2D color map and serve as an analog for PPG signal strength. These SNR values are processed from the central pixel in the highly pulsatile region of the tissue phantom for each illumination source. The LED array had the highest SNR, with a value of 8.614, showing its increased ability to identify strong PPG signal and pulsatile flow within the tissue phantom. The tungsten illumination module followed closely with an SNR value of 5.7887, which was also high. Finally, the single LED produced the lowest SNR value, with a value of 0.9957, which was representative of the poor signal observed in the 2D color map. See Table 1.
The results of the power spectral density (Figure 10) demonstrated a clear logarithmic trend. The amount of signal present at the pulsatile frequency increased with the illumination intensity. The increase in the amount of signal present at the pulsatile frequency led to an increase in the observed PPG signal in the image outputs. These results indicated that maximizing illumination intensity for the selected camera sensor was a critical parameter and also validated the necessity of uniform illumination across the field of view since darker regions along the fringes caused a loss in observed PPG signal.
Animal model
We assessed the light intensity from both the single LED and LED array illumination sources on normal, healthy tissue. For the single LED, the pixels in the region where the light was incident on the tissue were saturated (Figure 11A). The rest of the pixels in the image were illuminated at 50% or less of the camera's range of sensitivity. This led to large areas of normal, healthy tissue with no observable PPG signal, shown in the dark blue color in Figure 11B. On the other hand, illumination with the LED array demonstrated most of the pig's skin in the imaging area was reflecting a high amount of light, around 70 - 90% of the camera's range of sensitivity (Figure 11D). There were no saturated pixels and none of the pixels were completely dark. The uniformity of the LED array was expected to result in clear PPG signals across the FOV, because the variability of the illumination intensity was better controlled. As expected, the results showed the illumination from the LED array provided an output image with more uniform, high PPG signal from the healthy skin (Figure 11E). The SNR from a region of interest (white box in Figure 11B and Figure 11E) was plotted as a histogram (Figure 11C and Figure 11F). This showed that the distribution of PPG signal for the LED array was more uniform and there were no pixels lacking PPG signal (SNR > 0) when uniform illumination was used. In the area evaluated from the single LED, many of the pixels collected showed no PPG signal (SNR = 0), and the regions of tissue with PPG signal were sporadic and non-uniform.
Since arterial blood flow in a wound is a critical factor for healing and assessing tissue viability, the burn model was used to assess the applicability of these illumination patterns in burn wound assessment. Within a partial-thickness burn, there is damage to the arterial structures that carry blood throughout the tissue. It is expected that little to no blood flows in this damaged area. Therefore, little or no PPG signal would be acquired from burned skin.
For the single LED, the imaging results (Figure 12A) show the edge of the circular burn area is differentiated as burned tissue, but the center does not contrast the surrounding healthy skin tissue. The center of the burned region shows areas of PPG signal where necrotic, non-pulsatile tissue should be identified (Figure 12D). The region of the image where the illumination is directly incident on the tissue is saturated and no PPG signal was detected. Similarly, the peripheral regions opposite the spotlight are too dark to be assessed by the imager. For these non-burned tissues in the dark area and beneath the bright spotlight, the imaging result does not show a pulsatile blood flow signal, despite physiologically being healthy tissue.
For the tungsten light (Figure 12B), the FOV was evenly illuminated. In the imaging results, the edge, shape, and area of the burn wound were resolved (Figure 12E). The SNR contrast was adequate too, indicating the illumination induced sufficient PPG signal from the surrounding healthy tissue. Owing to the directivity of the incident beam, the illumination intensity on the right-hand half of the FOV was higher than the left half. Correspondingly in the imaging results, the right half of the image showed higher SNR contrast than the left half, inducing an interpretation error regarding the tissue on the right half as more viable than the left half of the FOV.
For the LED array (Figure 12C), illumination within the FOV was more even than the Tungsten light, corresponding to a cleaner PPG image. The imaging results (Figure 12F) showed the edge, shape, and area of the burn wound corresponded to the actual tissue. The healthy tissue surrounding the burn wound also showed more homogeneous PPG signal in the imaging results. The strip of unshaven hair on the bottom of the image reduced the PPG signal in that area of the image results, but the healthy tissue with blood perfusion below the hair still showed the same contrast as the remaining healthy tissue pixels.
Discussion and Conclusion
The configuration of the illumination plays an important role in an optical non-contact PPGI system. The spatial uniformity and intensity of the illumination were identified as key features of these systems. These variables were evaluated using a single LED, a tungsten light bulb, and an LED array. The illumination sources were assessed in both a tissue phantom model and a porcine burn model to evaluate the effect of these parameters on the quality of the PPG image outputs generated.
Tissue phantom results demonstrated that PPG signal was a function of illumination uniformity, and therefore, uniform illumination was ideal for accurate PPG signal acquisition in an imaging setting. Prior reflectance mode, non-contact PPGI systems have presented configurations with oblique illumination [23]. These configurations mimic transmissive modalities in the way the sensor collects photons of light from an area that is not under direct illumination, following a banana-like pathway as light enters and exits the skin. Our experiments highlighted the advantages of providing uniform illumination by placing the illumination source adjacent to the sensor. The sensor collected photons of light directly from the area of the target under illumination. The LED array and tungsten light bulb provided this pattern of illumination, contrasting the illumination provided by the single LED, which resembled the reflectance modes where illumination was off center and oblique to the area of image acquisition. The improved spatial uniformity from the LED array and tungsten light bulb led to higher SNR values and better PPG image outputs. A key feature for improving the performance of the non-contact PPGI system was the spatial uniformity of the illumination over the system's entire FOV.
The PSD values from the selected pixels in Figure 10 also showed that as illumination intensity increased, up to the maximum the sensor could resolve without saturation, the amount of spectral power present also increased. This increase in spectral power signified more accurate acquisition of PPG signal. These increases are what contribute to clinically useful image outputs.
The porcine burn model confirmed that the variable of illumination intensity impacted the accuracy of the PPG signal acquired. In the presence of a burn, the tissue damage attenuates blood flow, and a reduced PPG signal is expected. The LED array resulted in the most identifiable PPG signal of the three illumination options, which allowed greater differentiation of burn tissue from healthy tissue in the porcine burn model. The tungsten light bulb introduced slight directivity which impacted the systems performance. It identified regions of healthy tissue directly under the light source as more viable and as having higher blood flow than other areas of healthy tissue present within the image. The LED array was able to provide high illumination intensity across the entire FOV, without saturating pixels from the sensor, which led to accurate PPG image outputs.
Although the LED array provided the highest SNR values and provided more desirable PPG image outputs, additional light sources such as the tungsten light bulb could be configured to provide similar performance. IR filters to reduce generation of heat in the imaging target, as well as additional diffusers to more evenly disperse the light would increase the performance of the system and provide advantages similar to the LED array. The objective of this study was to understand how key parameters impacted the performance of the non-contact PPGI systems and the PPG image outputs they generated. Various illumination configurations and patterns could be created to replicate the performance of the systems discussed in this manuscript. The key is that with a high intensity, spatially uniform illumination source, the technical demands on other key components of the PPG system can be reduced.
Given technological improvements in hardware and computing power, the signal processing techniques discussed in this manuscript are widely used in the development of many optical imaging techniques. Processing times of seconds can now provide clinicians with real-time information to aid their clinical assessment and management of patient care.
A safe, non-invasive, and quick device that could perform blood perfusion evaluations in patients, such as this optical PPGI system, would provide great value to a clinician in the wound care setting. The study explored specific configurations of a non-contact PPGI system to identify which features were essential, and the information significantly improved the performance of the device. Using an illumination source such as the proposed LED array, which is capable of achieving high-intensity and uniform illumination across the FOV, the PPGI technology would be capable of delivering these clinical applications in an accurate and precise manner. An assessment of these features and the effect they have on performance had not been done previously. Areas of further exploration could involve assessing how various wavelengths of LED light affect acquisition of the PPG signal. This information could be relevant to other imaging technologies with similar components or features as PPGI, especially when discussing the combination of such technologies.
Disclosures
At the time of their contribution to this manuscript, all authors were receiving salary from SpectralMD, Inc. Thatcher, Fan, and DiMaio also report ownership in SpectralMD, Inc. through stock. This manuscript is based on work published in the conference proceedings of SPIE Photonic Therapeutics and Diagnostics XI.
Acknowledgements
This research was supported in part by the Biomedical Advanced Research and Development Authority (BARDA, Contract # HHSO100201300022C). Authors thank Sinclair Research Center LLC for animal experiment support.