Table 3: Relative quantities of the elements (provided
in wt.%) detected by energy dispersive
X-ray spectroscopy (EDX) on the as-is archwire, and new structures present on
the archwires UA and BA which were immersed in AS for 31 days (Figure 3 and
Figure 4). All the detected Ni and Ti quantities were found
statistically significant with P < 0.01 for UA and P < 0.001 for BA. (Elements with signals lower than
0.1 wt. % were not included in the table.)
|
|
As-is |
UA |
BA |
|
Carbon |
- |
4.59
± 1.01 |
4.22
± 0.47 |
|
Titanium |
46.43
± 0.78 |
46.06
± 2.74 |
45.99
± 1.23 |
|
Nickel |
53.57
± 0.78 |
49.36
± 2.33 |
49.79
± 1.14 |
|
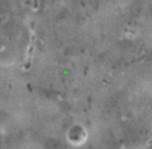
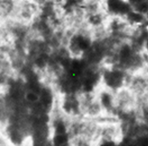
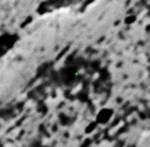
Representative SEM images of the
regions analyzed by EDX |
|
|
|