
International Journal of Magnetics and Electromagnetism
(ISSN: 2631-5068)
Volume 6, Issue 1
Research Article
DOI: 10.35840/2631-5068/6524

Article Formats
Evaluation of Plastic Deformation in Steels with Magnetic and Acoustic Techniques
Table of Content
Figures

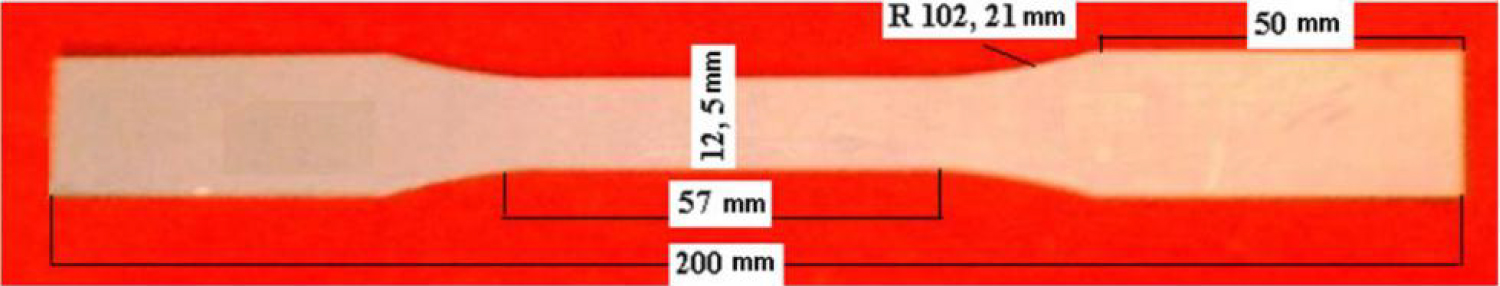
Figure 2: Dimensions of the specimen according to ASTM...
Dimensions of the specimen according to ASTM E8 standard.
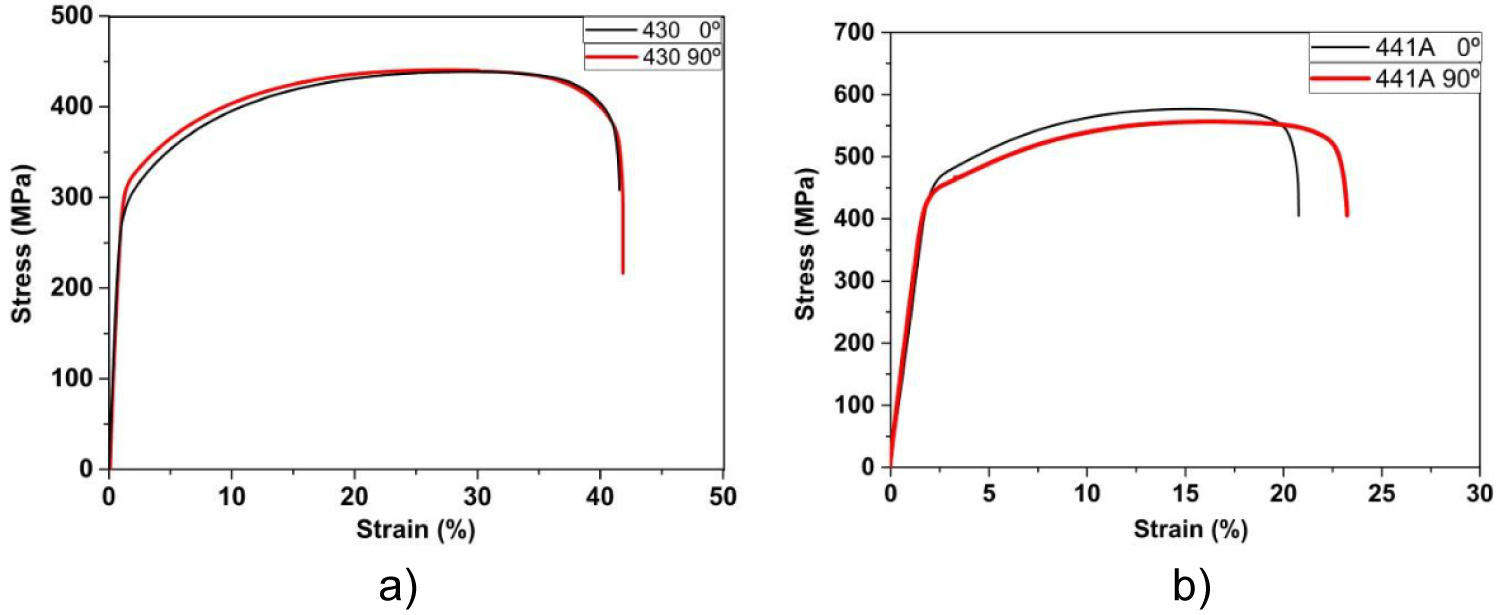
Figure 3: Curves of stress-strain (0° and 90°): a) AISI...
Curves of stress-strain (0° and 90°): a) AISI 430 y; b) AISI 441A.
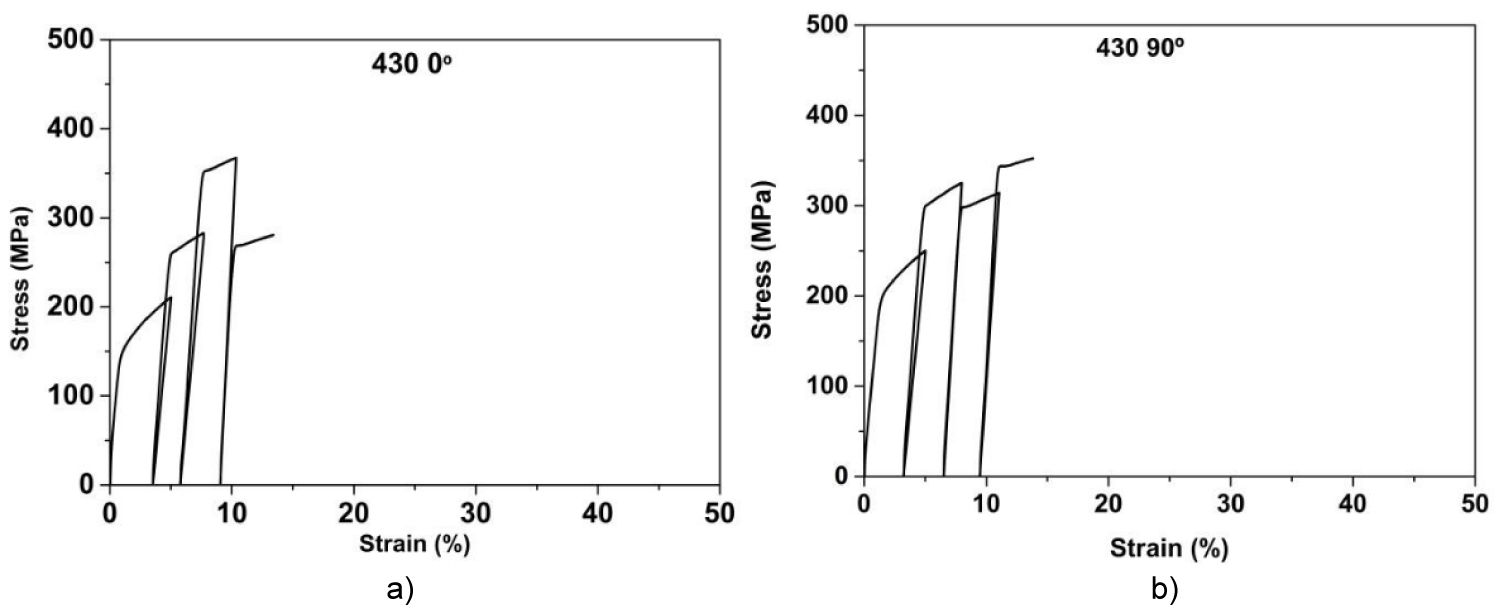
Figure 4: Reconstruction of stress-strain curves....
Reconstruction of stress-strain curves, AISI: 430, (0° and 90°).
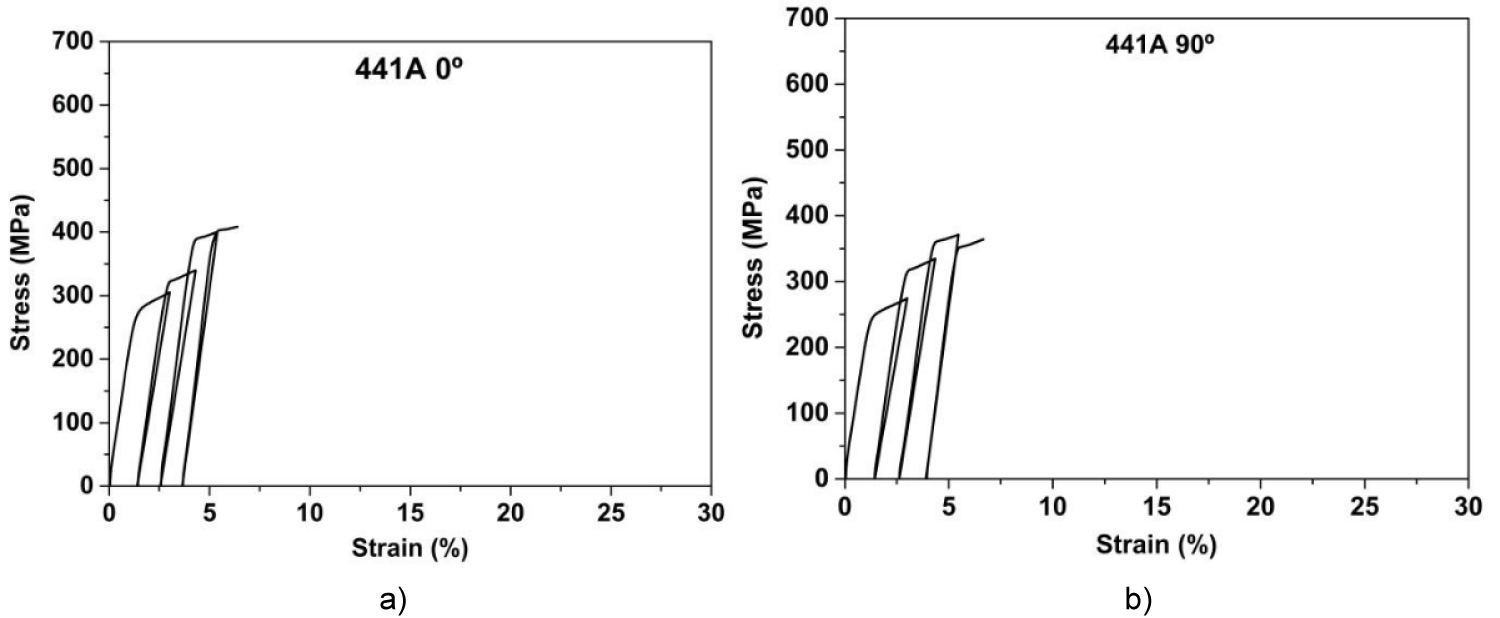
Figure 5: Reconstruction of stress-strain curves, AISI...
Reconstruction of stress-strain curves, AISI: 441 (0° and 90°).
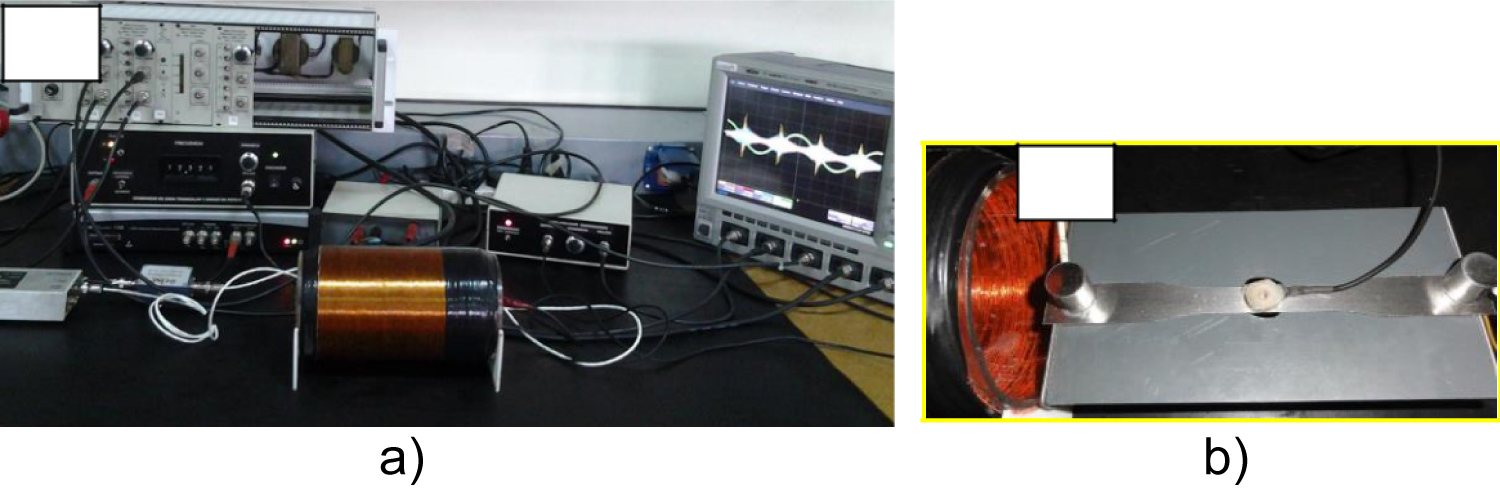
Figure 6: a) Photograph of MBN and MAE measurement systems...
a) Photograph of MBN and MAE measurement systems; b) Detail of the location of MBN and MAE sensors.
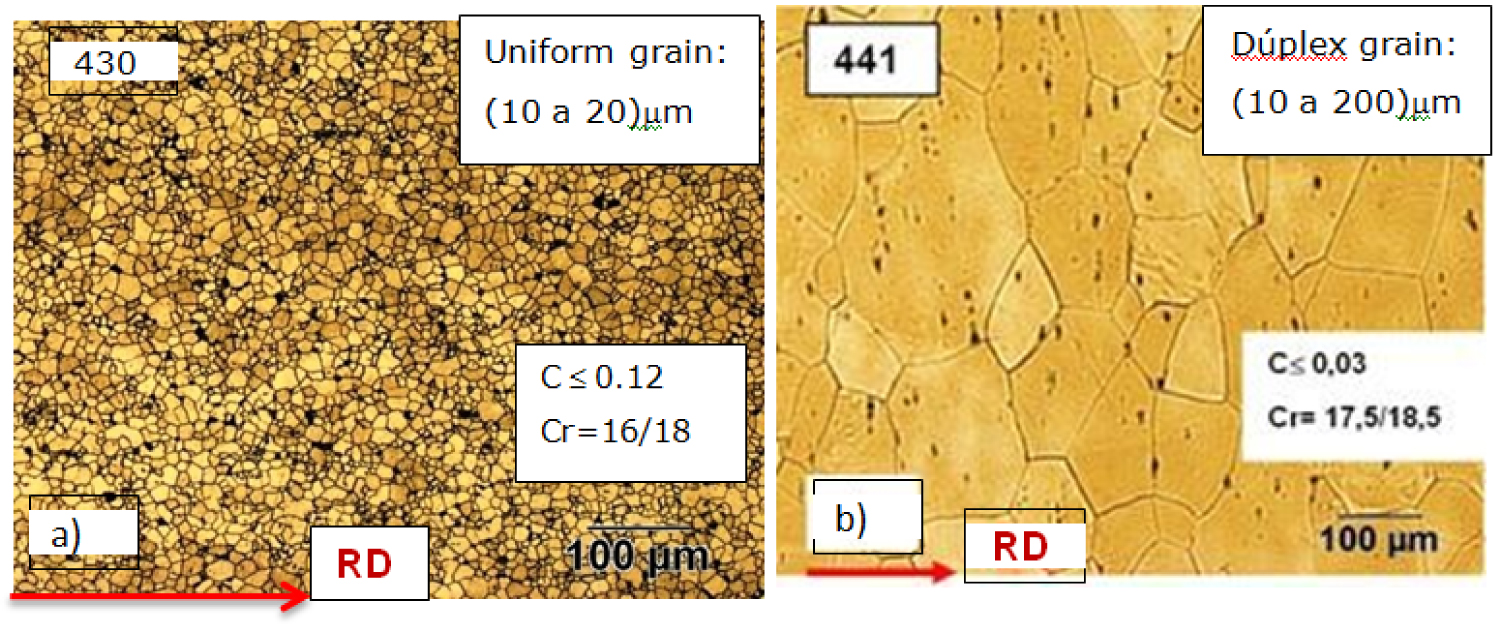
Figure 7: Optical micrographies of stainless steels...
Optical micrographies of stainless steels: a) 430 and b) 441A, without deformation. Red arrow indicates the rolling direction.
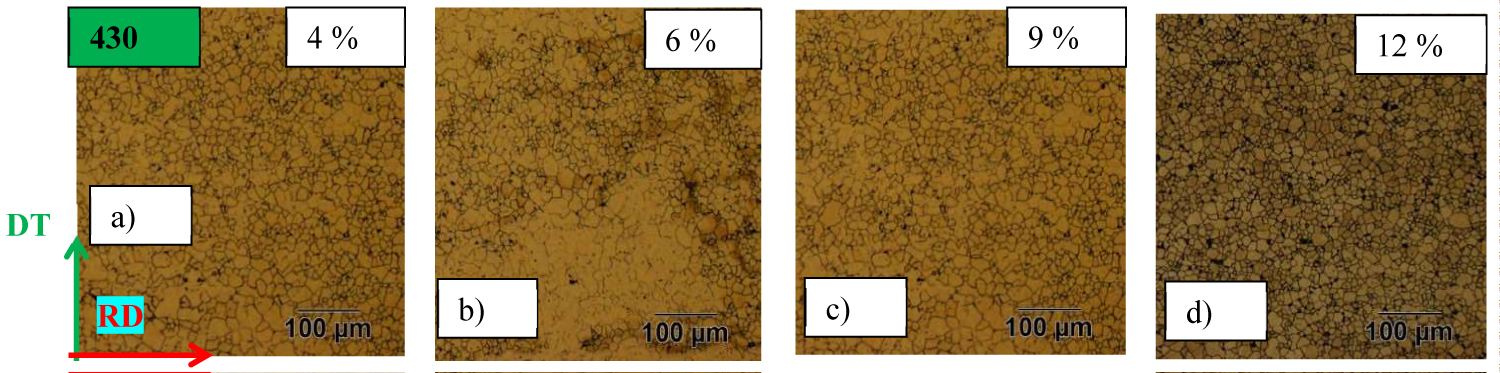
Figure 8: Optical micrographs of the AISI 430, deformed...
Optical micrographs of the AISI 430, deformed specimens: a) 4%; b) 6%; c) 9% and d) 12%. Red arrow indicates the rolling direction (RD) and green arrow, traction direction (TD).
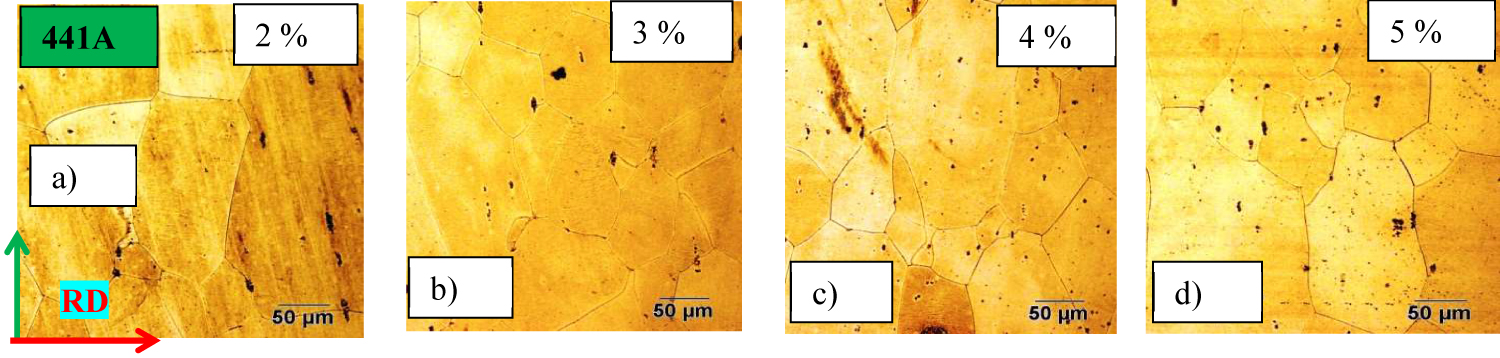
Figure 9: Optical micrographies of AISI 441A, deformed...
Optical micrographies of AISI 441A, deformed specimens: a) 2%; b) 3%; c) 4% and d) 5%. Red arrow indicates the rolling direction (RD) and green arrow the traction direction (TD).
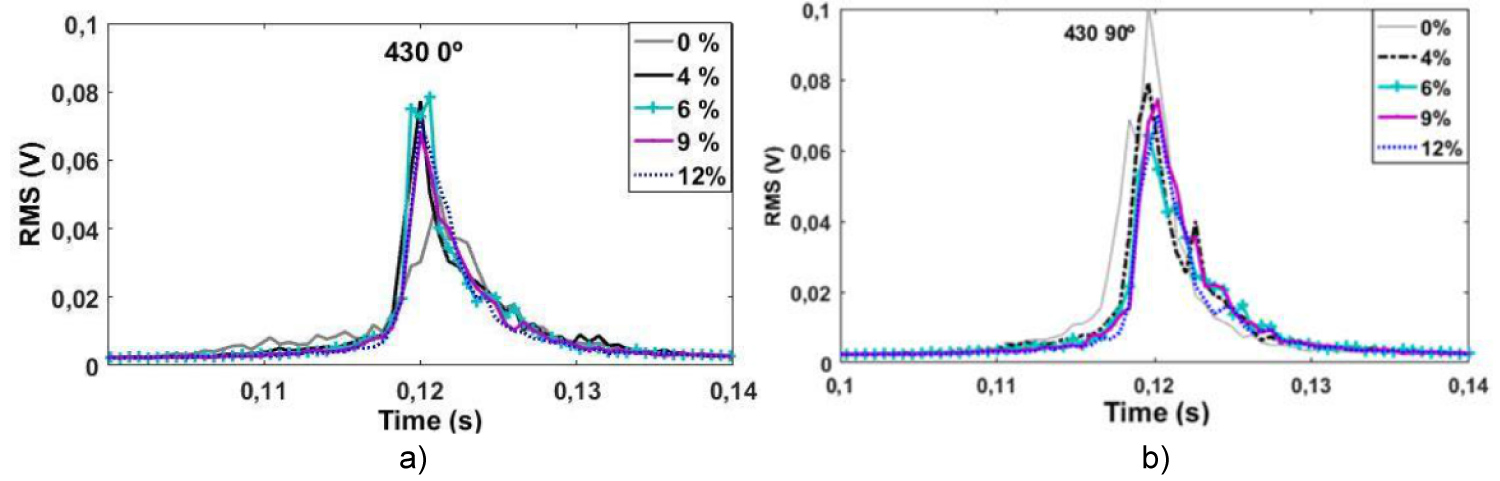
Figure 10: RMS (MBN) functions vs. time, for a half excitation...
RMS (MBN) functions vs. time, for a half excitation cycle: a) 0° and b) 90°, 430 steel.
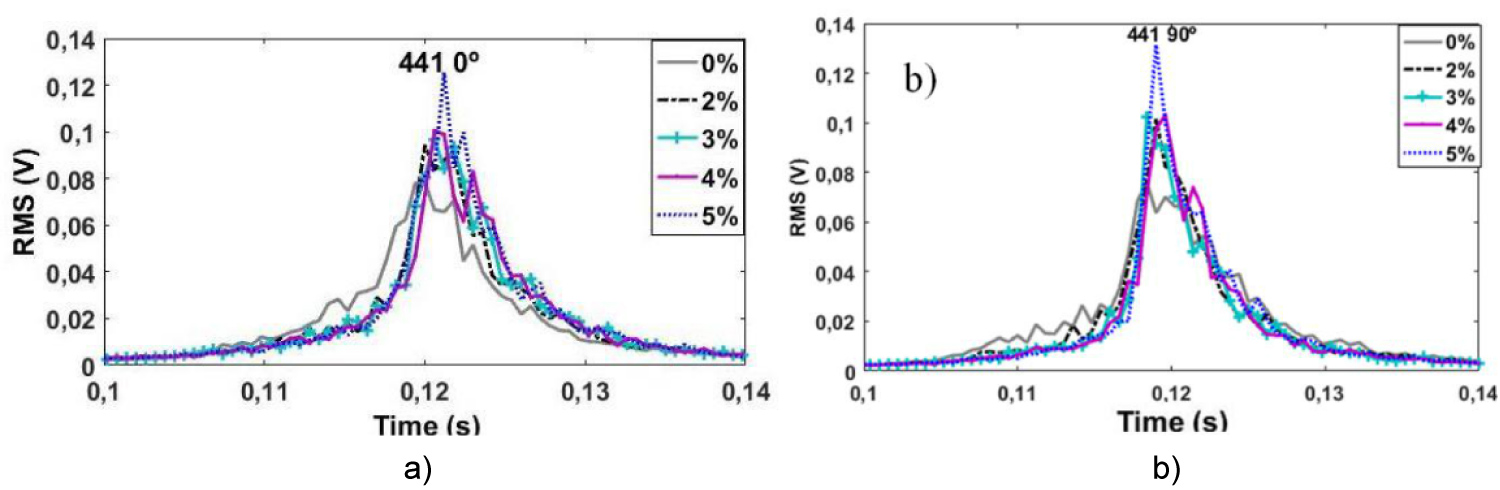
Figure 11: RMS (MBN) functions vs. time, for a half excitation...
RMS (MBN) functions vs. time, for a half excitation cycle: a) 0° and b) 90°, 441A steel.
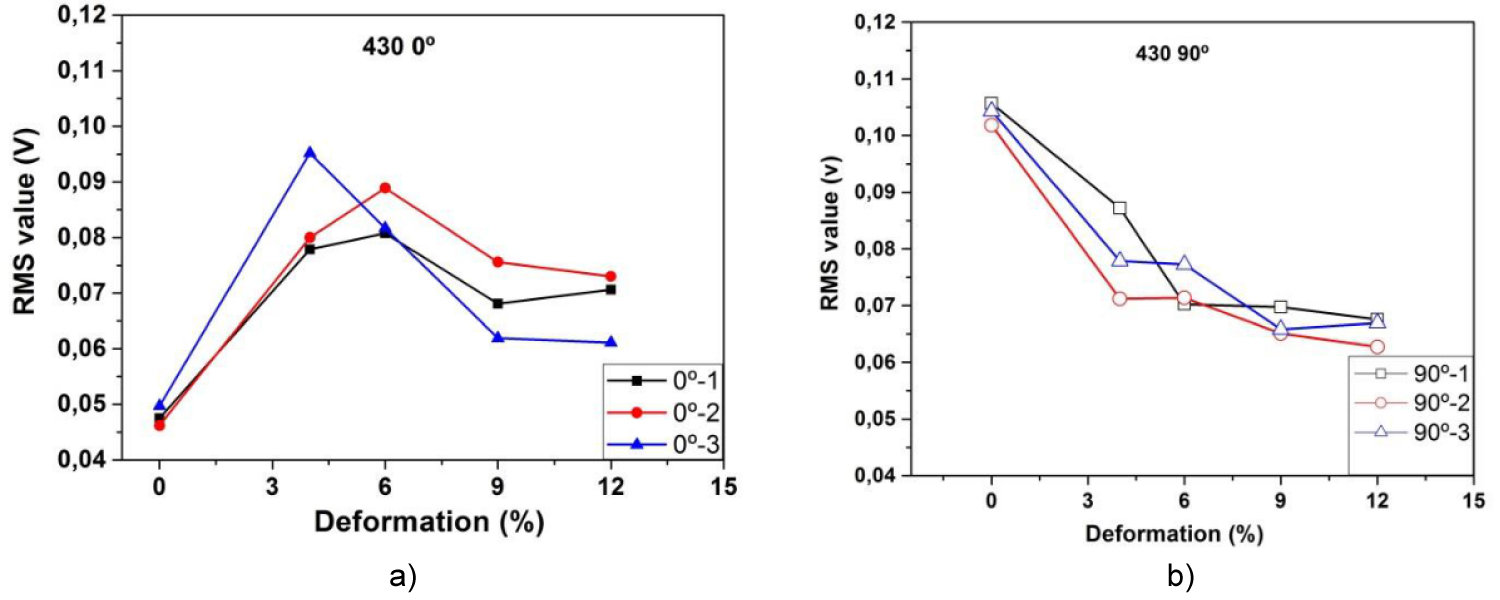
Figure 12: RMS value (MBN) as a function of deformation...
RMS value (MBN) as a function of deformation: a) 0° and b) 90°, three specimens for each direction, steel 430.
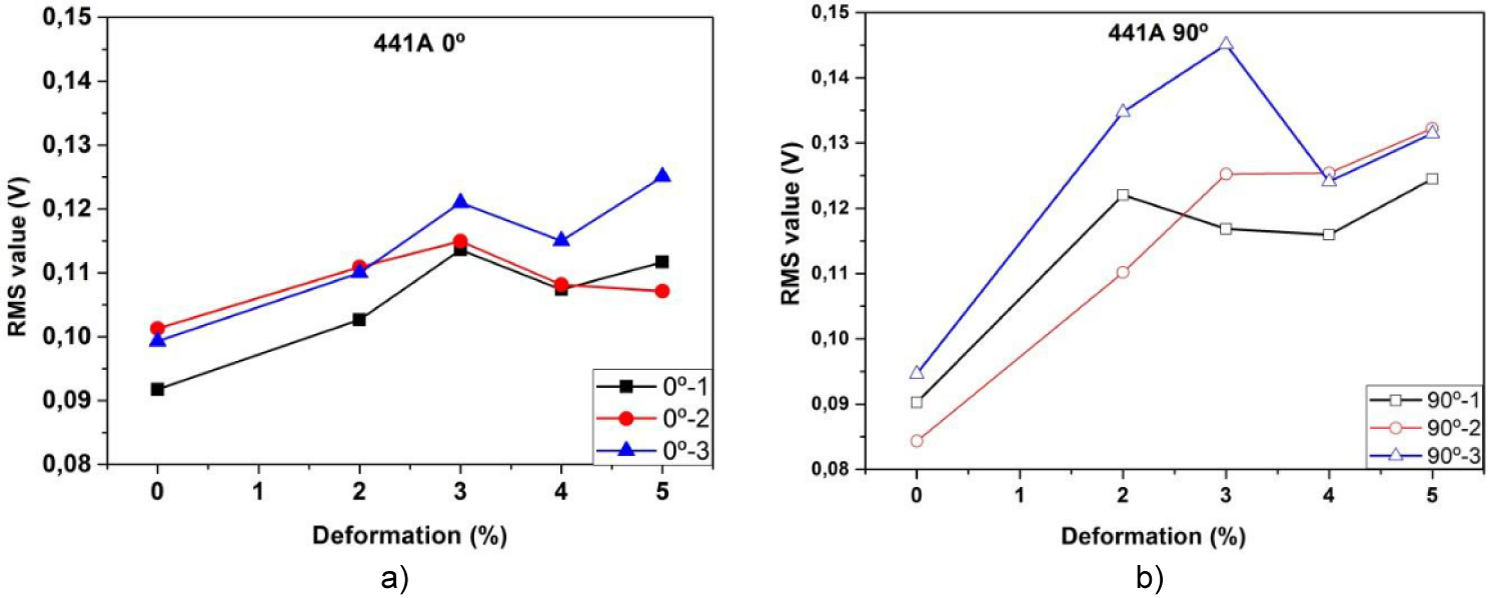
Figure 13: RMS value (MBN) as a function of deformation...
RMS value (MBN) as a function of deformation: a) 0° and b) 90°, three specimens for each direction, steel 441A.
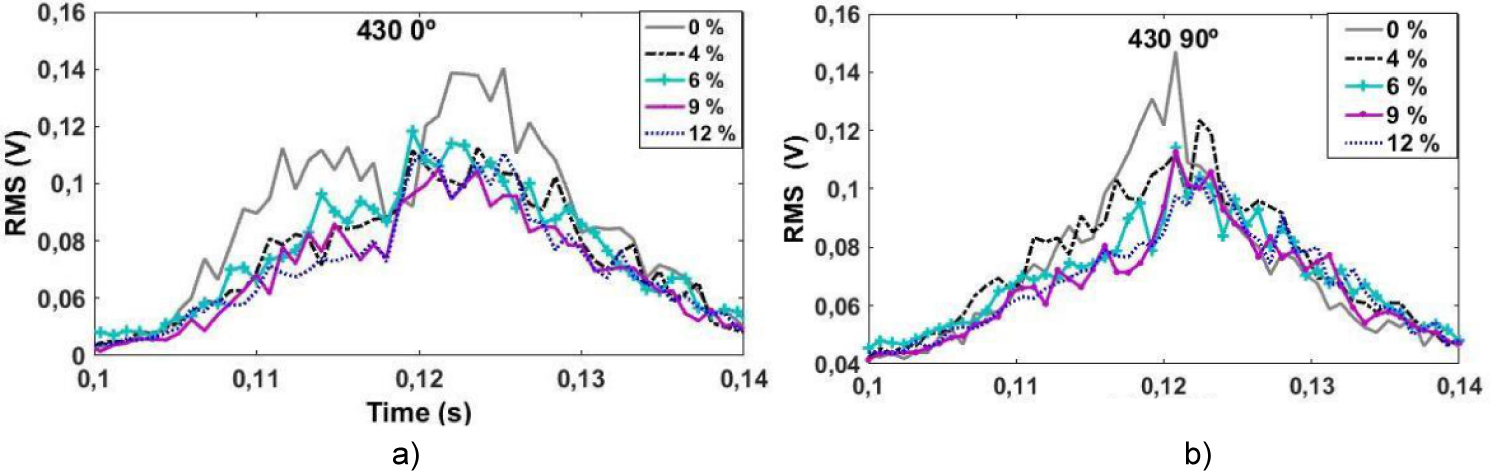
Figure 14: RMS (MAE) function vs. time, for half excitation...
RMS (MAE) function vs. time, for half excitation cycle: a) 0° and b) 90°, steel 430.

Figure 15: RMS (MAE) function vs. time, for half excitation...
RMS (MAE) function vs. time, for half excitation cycle: a) 0° and b) 90°, steel 441A.

Figure 16: RMS value (MAE) as a function of deformation...
RMS value (MAE) as a function of deformation, steel: a) 430 and b) 441A.
Tables
Table 1: Chemical composition of the samples (% weight) [ArcelorMittal Inox Brasil].
Table 2: Mechanical properties of the stainless steels: AISI 430 and AISI 441A.
Table 3: Vickers microhardness for different strain stages.
References
- Neyra Astudillo MR, Nicolás N, María Isabel LP, José R, Rodríguez LP (2014) Ruido Magnético Barkhausen y Emisión Magneto Acústica en Ensayos de Tensión Uniaxiales en Placas de Acero Inoxidable. Anales SAM-CONAMET.
- Jiles DC (1995) Introduction to magnetism and magnetic materials. Chapman and Hall, UK.
- Neyra Astudillo MR (2018) Caracterización de Materiales con Técnicas de Ruido Magnético Barkhausen y Emisión Magneto Acústica. Universidad Nacional de San Martín-Comisión Nacional de Energía Atómica, Argentina.
- Piotrowski L, Augustyniak B, Chmielewski M, Hristoforou EV, Kosmas K (2010) Evaluation of barkhausen noise and magnetoacoustic emission signals properties for plastically deformed Armco iron. IEEE Transactions on Magnetics 46: 239-242.
- Stefanita, Gabriela C (2008) From bulk to nano: The many sides of magnetism. Springer Series in Materials Science.
- Castillo Guerra RA (2013) Informe Técnico MMO 2013-007: Informe de MicrodurezaVickers, Gerencia de área de Energía Nuclear, Gerencia de Materiales, Laboratorio de Ensayo de Materiales, Argentina.
- Praxedes TO (2012) Sistema experimental para a realização de ensaios não-destrutivos magnéticos e sua aplicação na avaliação da degradação microestrutural do aço A516 grau 60. Universidade Federal do Ceará, Brasil.
- Tsuchida Y, Enokizono M (2017) Residual stress evaluation by barkhausen signals with a magnetic field sensor for high efficiency electrical motors. AIP Advances 8: 047608.
- Miriam Rocío NA, Nicolás N, María Isabel LP, José R, Rodríguez LP (2018) Ruido magnético barkhausen para el estudio de la anisotropía magnética en aceros inoxidables. Revista Materia.
- Jagadish C, Clapham L, Atherton DL (1990) Influence of uniaxial elastic stress on power spectrum and pulse height distribution of surface barkhausen noise in pipeline steel. IEEE Transactions on Magnetics 26: 1160-1163.
- Cheng K (1997) The dependence of barkhausen emisión on the microestructure of steel plate. Thesis submitted the Master of Philosophy in Physic, Departament of Physics, The Chinese University of Hong Kong, Hong Kong.
- Kypris O, Nlebedim IC, Jiles DC (2014) A model for the barkhausen frequency spectrum as a function of applied stress. Journal of Applied Physics 115: 083906.
- Branco da Silva Jorge PM (2015) Estudo sobre o ruído originado pela magnetostrição em transformadores de potência. Universidade de Porto, Brasil.
- O'Sullivan D, Cotterell M, Tanner DA, Mészáros I (2004) Characterisation of ferritic stainless steel by Barkhausen techniques. NDT & E International 37: 489-496.
- Zhang S, Shi X, Udpa L, Deng Y (2018) Micromagnetic measurement for characterization of ferromagnetic materials' microstructural properties. AIP Advances 8: 056614.
- Volkers R (2008) The influence of dislocations on the magnetic properties in steel. Master's Thesis, Delf University of Technology, Netherlands.
- Cullity BD, Graham CD (2009) Introduction to magnetic materials. (2nd edn), John Wiley & Sons, Inc, Hoboken, New Jersey, United States.
- Piotrowski L, Augustyniak B, Chmielewski M, Kowalewski Z (2011) Possibility of application of magnetoacoustic emission for the assessment of plastic deformation level in ferrous materials. IEEE Transactions on Magnetics 47: 2087-2092.
- Piotrowski L, Augustyniak B, Chmielewski M, Tomas I (2009) The influence of plastic deformation on the magnetoelastic properties of the CSN12021 grade steel. Journal of Magnetism and Magnetic Materials 321: 2331-2335.
- Ng DHL, Jakubovics JP, Scruby CB, Briggs GAD (1992) Effect of stress on magneto-acoustic emission from mild steel and nickel. Journal of Magnetism and Magnetic Materials 104-107: 355-356.
Author Details
Miriam Rocío Neyra Astudillo1,2*, Nicolás Núñez1, María Isabel López Pumarega1, José Ruzzante3,4 and Martin Gómez1,2
1Dpto. Coordinación Centro Internacional para Estudios de la Tierra, ICES, Gerencia Desarrollos Tecnológicos y Proyectos Especiales, Gerencia de área Investigaciones y Aplicaciones No Nucleares, Centro Atómico Constituyentes, Argentina
2Departamento de Eléctrica, Fac. Reg. Delta, Universidad Tecnológica Nacional (UTN), Argentina
3Grupo de Emisión Acústica, Fac. Reg. Delta, Universidad Tecnológica Nacional (UTN), Argentina
4Universidad Tres de Febrero, Caseros, Argentina
Corresponding author
Miriam Rocío Neyra Astudillo, Dpto. Coordinación Centro Internacional para Estudios de la Tierra, ICES, Gerencia Desarrollos Tecnológicos y Proyectos Especiales, Gerencia de área Investigaciones y Aplicaciones No Nucleares, Centro Atómico Constituyentes, Av. G. Paz 1499, San Martín, Buenos Aires, B1650KNA; Departamento de Eléctrica, Fac. Reg. Delta, Universidad Tecnológica Nacional (UTN), San Martin 1171, Campana, BA 2804, Buenos Aires,
Accepted: February 04, 2020 | Published Online: February 06, 2020
Citation: Neyra Astudillo MR, Lopez Pumarega MI, Ruzzante J, Gomez M (2020) Evalution Deformation in Steel with Magnetic and Acoustic Techniques. Int J Magnetics Electromagnetism 6:024
Copyright: © 2020 Astudillo MRN, et al. This is an open-access article distributed under the terms of the Creative Commons Attribution License, which permits unrestricted use, distribution, and reproduction in any medium, provided the original author and source are credited.
Abstract
Barkhausen Magnetic Noise (MBN) and Magnetic Acoustic Emission (MAE) are phenomena that occur in ferromagnetic materials which undergo changes in their magnetization. These phenomena are very sensitive to changes on microstructure and residual stresses. The MBN and MAE can be applied as monitoring techniques to detect plastic deformation in materials subjected to thermomechanical processes, such as machining and manufacturing processes. In this work, the plastic deformation in samples subjected to uniaxial tensile tests is investigated through MBN and MAE. Twelve stainless steel test pieces of two different materials (AISI 430 and AISI 441A), were tested. As a first step, in order to obtain their mechanical properties, two test pieces of each material cut in different directions with respect to the rolling direction, were tested up to rupture. The others were deformed in four stages on plastic deformation. After each stage, MBN and MAE measurements were made, in order to obtain a correlation with the strain and the magnetic situation of the materials. We present here the microstructural analyses, the study of MBN and MAE signals, correlating them with the state of deformation of the specimens.
Introduction
Industrial components under mechanical stresses usually suffer elastic or plastic deformations and consequently, their material structure changes. These components are commonly made of steel, which frequently is a magnetic material.
Magnetic Barkhausen Noise (MBN) is widely used as a non-destructive method for evaluating the state of ferromagnetic materials [1]. The MBN is originated by the movement of the walls of the Magnetic Domains (MDW), when a slowly varying electric current is generating a variable magnetic field on the material.
Apart from the effect of the MBN, its acoustic analogue can be detected: The Magneto Acoustic Emission (MAE). The signal of the MAE is generated during the continuous movement of the MDW at 90°, in materials with a non-zero magnetostriction. The MBN and the MAE depend on the characteristics of the material, such as grain size, carbon content, microstructure and applied mechanical stresses. A further advantage of the MAE signal is to detect the changes from the entire magnetized volume, due to the weak acoustic wave attenuation in steels.
Therefore the measured depths for MAE are higher than those for MBN. Consequently, MAE has the potential to provide a complementary inspection technique to MBN, both in terms of depth of measurement and in terms of different sensitivity to microstructural configurations. MBN has been known for more than sixty years and many papers have been published, but in several cases there is no adequate interpretation and there is still a need for systematic research. MAE, on the other hand, is a much more recently discovered phenomenon and its use shows potential in many areas, but a more difficult understanding of the involved phenomena remains.
The influence of plastic deformation on the properties of MBN and MAE has been studied by several authors. Some studies report a decrease in MBN with increasing plastic deformation [2-5]; others report that MBN amplitudes increase when plastic deformation increases, reaching a maximum value for a certain level of deformation and then, with a new increase in deformation levels, the amplitudes of the MBN begin to decrease and finally saturate at low levels [6-12].
All the studies found with respect to MAE in alloys based on Fe, show the same tendency of reduction with deformation. This fact is explained in the following way: As the plastic deformation increases, the dislocation density increases together with an increase in dislocations interaction with MDW. The interaction between the walls of the domains and the dislocations seems to be stronger for MDW of at 180°, than for MDW at 90° [13-19].
It was reported by O'Sullivan D, et al. (2004) when they used MBN and MAE techniques to characterize samples of ferritic stainless steel (AISI 430), plastically deformed and heat treated that MAE and MBN decreased with the increasing of material permanent deformation. They explain the results in terms of the different mechanisms that affect the interactions between dislocations and MDW.
In the present study, the analysis of MBN and MAE in standardized uniaxial tensile samples of ferritic stainless steels (AISI: 430 y 441A) is presented for different plastic deformation stages. After each stage, the samples were dismantled and measured at the laboratory with MBN and MAE systems. The MBN and MAE amplitude and RMS values were analyzed as a function of time, correlating them with the plastic deformation and the microstructure in each stage.
The results show how the differences in the microstructure produced by the plastic deformation affect the characteristics of MBN and MAE. Although in the microstructural analysis the deformation produced in the grains was not clearly manifested, probably due to the low deformations reached, nevertheless the MBN and the MAE did show differences. These differences are qualitatively and quantitatively discussed.
Experimental Method
Material description
All the samples studied were obtained from plates (rectangular dimensions of 300.0 mm × 210.4 mm) of ferritic stainless steel: AISI 430 and AISI 441A. The plates were cold rolled and annealed with final thicknesses of 0.69 mm (AISI 430) and 0.85 mm (AISI 441A). Figure 1 shows a photograph of one of the plates, indicating the rolling direction (black arrow) that coincides with the direction of the smaller side of the rectangle. The specimens were cut according to ASTM E 8 standard. A total of 12 specimens were made, 3 cut in the rolling direction (0°) and 3 cut in a perpendicular direction (90°), for both steels. In Figure 2, a photograph of one test samples is shown with its dimensions. Table 1 shows their chemical compositions (as indicated by the manufacturer).
Plastic deformation
To obtain the mechanical properties of these two materials, samples of 0° and the other of 90° were tested up to rupture. A 100 kN Shimadzu traction machine controlled by a computer was used. The stress measurements were recorded as a function of deformation. The tests were carried out at room temperature, with a constant speed of 1 mm/min, following a Standard [IRAM IAS-U500-102].
Figure 3 shows the overlapping Stress-Strain curves (0° and 90°) for the two stainless steels: 430 and 441A. The curves show a rounded appearance without any inflection point that indicates the elastic limit for the material, so the tension corresponding to 0.2% of the plastic deformation must be chosen as its limit. Table 2 shows the mechanical properties of the steels under study (obtained from the tensile test curves for 0° and 90°).
The 0° and 90° samples of both materials were deformed in four successive stages. Two specimens of the same material were deformed until a deformation D1; and then they were tested in the AE Laboratory, measuring MBN and MAE using a solenoid around them to produce the magnetic field. Then, they were deformed up to D2; Repeating the MBN and MAE tests. The same procedure was used until the fourth deformation D4. Figure 4 and Figure 5 show the reconstruction of the successive deformation stages, for the specimens of both AISI steels: 430 and 441A (0° and 90°).
MBN and MAE systems
For MBN and MAE measurements, the specimens were excited by a variable magnetic field inside a solenoid coil. It was a sine wave: 10 Hz and 1.5 V. The maximum current intensity was 0.6 A, producing a maximum magnetic field of 4.4 kA/m. The MBN sensing coil was connected to an amplifier with a pass band (1-500) kHz and low noise level. To capture the MAE, two sensors were used: One resonant (150 kHz) with built-in pre-amplifier, PAC R15I-AST S/N DN32 model, and another broadband AE65 model. The sensing coil of the MBN was located in the central zone of the test piece and the two MAE sensors in each extreme.
The direction of the field produced by the solenoid was parallel to the axial direction of the specimen. After each stage of plastic deformation, MBN and MAE were measured in each of the deformed specimens (0° and 90°), for each type of steel. All signals were recorded on a LeCroy digital oscilloscope. In Figure 6, the photograph of the measurement system and the location of the sensors are shown.
Results and Discussion
In next sections, microstructural analysis, MBN and MAE signals are analyzed and commented.
Microstructural analysis
The optical microscopies of the samples (AISI 430 and 441A) without deformation are shown in Figure 7.
In both materials, the deformation produced by the initial lamination was not clearly manifested, no elongated grains were observed. The 430 steel (Figure 7a) shows a uniform grain size of 10 μm to 20 μm and the 441A steel (Figure 7b) exhibits a bimodal grain size with variation between 10 μm to 200 μm [6].
In Figure 8, the optical micrographies for AISI 430 steel are shown, for the following stages of uniaxial deformation: a) 4%; b) 6%; c) 9% and d) 12%. As it can be seen, no significant changes are observed as deformation increases.
In Figure 9, the optical micrographies for AISI 441A are shown, for the following deformation stages: a) 2%; b) 3%; c) 4% and d) 5%. Due to the fact that the deformations not sufficiently large, a sharp elongation of the grains in the traction direction (TD) was not detected.
In Table 3, results of the Vickers microhardness are shown for each specimen with different deformation percentages. It is observed that there is an increase of the microhardness with increasing deformation; this is due to the hardening of the material. The mechanisms of the hardening are not known with precision, but during deformation new dislocations are created that interact with the existing ones, creating tangles of dislocations. With increasing deformation the dislocations density increases, making their movement more difficult and then the material ductility decreases [3].
Magnetic Barkhausen Noise and magneto acoustic emission
In order to deepen the analysis of the magnetic behavior, measurements of the hysteresis cycles were made for the original material and after each deformation stage. No significant differences were found, probably because the specimens did not suffer large deformations [3].
In MNB and MAE measurements, 4 files were recorded: One for the excitation voltage, one for the MBN and two for the MAE (broadband and resonant sensors). Thus, considering the two cutting directions of the test pieces (0° and 90°), 8 recorded files were obtained for each steel and each deformation. All the signals were digitized with a frequency of 2.5 M Samples/s. In all cases, the signals corresponding to a half of the excitation cycle were analyzed.
Magnetic Barkhausen Noise: The MBN sensor was placed in the center of the calibrated area of the specimens. In each material and for each cutting direction, three identical test pieces were proved: 0°-1, 0°-2 and 0°-3; the same for 90°. Due to the similarities of results, as examples, only the results of one of the specimens in each direction are shown. The obtained MBN signals were noisy, for this reason a digital filter was used as a first step of processing: Butterworth type bandpass, 4th order, with a pass band (5 kHz-200 kHz).
In Figures 10 and Figures 11, the RMS function of the MBN (half excitation cycle) is shown for the AISI 430 and 441A steels, for 0° and 90°.
The behaviors of the RMS MBN function as a response to compression and traction is generally interpreted in terms of the magnetoelastic effect. For materials with positive magnetostriction, the application of a tension stress promotes the reorientation of the domains so that their direction of magnetization is aligned along the axis of tension, in order to reduce the elastic energy. For materials with negative magnetostriction, for low fields, the magnetization of the domains will tend to align them 90° from the tension axis. In addition to the changes in the structure of domains due to the applied voltage, there is the possibility of changes in the volume of the domains [10-12]. The MBN is usually associated with the movement of the 180° MDW. The MBN will increase when the magnetic field is in the same direction as the applied tension, mainly because there are more 180° walls available to move [10].
As stainless steel has positive magnetostriction, when subjected to applied tensions or by the effect of the residual tensile stress parallel to the field direction, the number of MBN emissions increases, due to the ease of movement of the MDW in that direction [13]. In the case of AISI 441A, in Figure 11a and Figure 11b for the 0° and 90° specimens, it is observed that the RMS value increases as the deformation grows. In the case of the 430°, in Figure 10 a) in the 0° samples, it is seen that until the second deformation stage, the RMS value increases and then it decreases. In b) for the 90° specimens, it is observed that as the deformation increases the RMS decreases. This could be explained as follows. The AISI 441A, has a lower percentage of C and has larger dimension duplex grains compared to the ASI 430, which has a higher percentage of C forming Cr carbides (harder second phase particles) (see Figure 7a) and Table 1) and they have smaller and uniform grain size (10 µm to 20 µm). A larger grain size means that they have more domains and fewer pinning points (grain edges) in their microstructure. This means that the MDW can move more freely, generating an increase of MBN with tensile deformation increase. The same results were found in a sample of AISI 430 by O'Sullivan D, et al. This can be explained as follows: The decrease of MBN with the plastic deformation can be attributed to the fact that as the deformation increases, the density of dislocations increases and this produces a change in their distribution. Thus, the MDWs are blocked or maintained in their places. Due to the increasing degree of interactions between the MDW and the dislocations when increasing the plastic deformation, the magnetizing force is not big enough to release them and reduces the movement of the MDW, decreasing the MBN. On the other hand there is also a greater hardening of the material as the deformation increases [14,15].
For 441A steel, according to the stress-strain curve, the instability results could be due to the deformation range studied that is very near to the beginning of the creep zone. In this zone, the deformation is not homogeneous. For 430 steel, deformations occur in the first back later region to creep zone. In this region, the structure of dislocations changes significantly and homogeneously in a macroscopic view. MBN results are clearly affected by these changes in dislocations density, but their details are less clear. There is a subtle relationship between small defects such as dislocations and the MBN. In general, it is assumed that a greater number of defects increases the activity of the MBN, since there will be more sudden movements of the MDW. However, if these defects act as strong pinning sites, they prevent the movement of MDW, and thus the activity of the MBN will decrease [15].
On the other hand, if the defects are too weak, they will not act as anchor points, but they dampen the movement of the MDWs, therefore slowing down the sudden changes, resulting in a lower activity of the MBN.
For relatively isolated dislocations, it is still not clear whether sufficiently large defects can act as pinning points and, therefore, whether the MBN activity will increase or decrease. The anchoring resistance of isolated dislocations and tangles of dislocations are possible. Isolated dislocations may have sufficient force to act as pinning points, which means that their presence will increase the MBN. Alternatively, isolated dislocations may have insufficient clamping force to act as pinning points, but they act as buffers for the movement speed of the MDW, which means that their presence would decrease the MBN [15,16].
It is also observed that in the case of the samples of the AISI 430 without deformation, the RMS function has a lower amplitude than in the specimens of the AISI 441A. This could be due to the fact that the 430 steel has a smaller and uniform grain size (10 μm to 20 μm), compared to 441 A of duplex grain (10 μm to 200 μm).
For the analysis of the temporal function of the RMS of the MBN, in the two steels studied and in the two cutting directions, it is observed that when increasing the percentage of plastic deformation: (i) Functions tend to shift to the right, and (ii) The amount of peaks tend to decrease in each curve, appearing only a central peak. The displacement of the curves to the right is due to the fact that more energy is required (greater current in the solenoid) to produce the movement of the MDW. This accounts the "delay time" that each RMS function has from the beginning to the maximum, at each stage of deformation [1-3]. The decrease in the number of peaks and their transformation into a central peak could be due to the fact that the MBN signals are generated mainly by processes connected with the rapid reorganization of the structure of the MDW, due to the creation and annihilation of the domains. As the deformation progresses, the tangles of dislocations are created, and the anchoring mechanism slowly becomes predominant, leading to the appearance and subsequent increase of a central peak [4].
To compare the MBN signals quantitatively, the RMS value of three repetitions of each test specimen (0° and 90°) was determined in each of the deformation stages. In Figure 12 and Figure 13, the RMS values are displayed as a function of plastic deformation. Considering the repetition of the 3 test samples, as it can be seen, there is small dispersion for each deformation. It is observed that for the AISI 430, the RMS values tend to decrease with deformation and for AISI 441A the effect is opposite, the same results that were observed in the analysis of the RMS function.
Magneto acoustic emission: As mentioned above, while measuring the MBN, the MAE sensors were located at the extreme of the sample, one resonant and the other a broadband sensor. In each material and for each cutting direction, three test pieces were tested. Due to the repeatability obtained, as an example, only the results of one of the specimens in each direction are shown. Figure 14 and Figure 15 show the results obtained in the temporal evolution of MAE (half a cycle) for AISI 430 and 441A (0° and 90°), in each stage of plastic deformation.
In all studied MAE cases, it is observed that when deformation increases, the amplitude of the RMS function and the number of peaks decrease. Thus the intensity of MAE is reduced with deformation, by the process of generation of dislocations that form blockages and tangles, making the movement of MDWs increasingly difficult, as other authors point out [4,5].
The influence of the plastic deformation on the magnetic properties can be seen in the change of the hysteresis cycle, some examples of the cycles of the deformed materials are seen in Figure 9 and Figure 10. Although in these figures no clear differences in coercivity due to deformation are observed, they are clearly seen in the region of the "knee" of each hysteresis cycle, where there is a separation that increases with deformation [17]. This is very important for MAE measurements, since these are the most active regions. The reason for this arises from the fact that in these regions a large rearrangement of the structure of domains and closure domains takes place, separated by the 90° MDW that are created and/or annihilated, producing the greatest change in volume. Due to the uniformity of the magnetostriction depending on the direction of the applied field, the movement of the 180° MDW does not play an important role in the process of generating the MAE. The maximum amplitude of the RMS function is normally observed in the "knee" of the hysteresis cycle. The shape of the RMS function does not change significantly with deformation, which leads only to the increase in the separation of the peaks. Changes in the form of the function, even though very pronounced, are often not easily applicable for non-destructive testing of materials as they are not easy to quantify, that is why the separation of the peaks of the MAE is not a useful parameter [18].
In the case of AISI 441A (0° and 90°), the samples without deformation present an amplitude of the RMS function of the MAE, almost 5 times greater than the same function of the MBN (Figure 15 and Figure 11). This is not observed in the case of AISI 430, since they maintain the same order of magnitude with each other (Figure 14 and Figure 10). It should also be taken into account that MAE is produced in a volume greater than the MBN, since it originates in all the volume excited by the magnetic field.
For the AISI 430 (higher C-content, Table 1), it is observed that the amplitude of the RMS function of MAE, is much lower than in the other steel (Figure 14 and Figure 15). It is also seen that for the first deformation stage of the 430 it is not observed a very pronounced decrease as in the case of 441A, which was almost 50% of its intensity. This could be due to the carbide phase acting as an effective site for fixing the MDW of 90° [20].
Regarding the MAE, it is observed in all the studied cases, that the RMS function decreases with the increase of the plastic deformation. This can be explained by the magnetoelastic energy (Eme) in the following equation:
(1)
Where: is the saturation magnetostriction , the voltage and the angle between the directions of the magnetization vector (M) and . The application of a tension to the steel will cause M to be aligned along the direction of stress , so that the Eme is minimized. This would increase the total area of the 180° DW at the expense of the 90° DW, consequently, the MAE intensity is reduced [20]. As the plastic deformation increases, the dislocation density increases with an increase in the interaction between the MDW and the dislocations. The interaction between the MDWs and the dislocations seems to be stronger for the 180° DWs than for the 90° DWs [14].
To compare MAE signals quantitatively, the RMS value of three repetitions of each test pieces (0° and 90°) were plotted for each deformation stages. This was applied for each material. In Figure 16, the RMS values of MAE are shown. As it can be seen there is small dispersion for each deformation. In all cases the trend of RMS values shows a decrement with deformation.
Conclusions
Two ferritic stainless steels were studied and tested by uniaxial traction in four different deformation stages. After each deformation stage, both materials were characterized metalographically and magnetically (hysteresis loops, MBN and MAE).
In metallographies a clear elongation of the grains in the direction of applied traction was not observed, probably because the attained deformations were close to the creep zone.
In the studied steels, for the smaller grain size (AISI 430), the lower amplitudes for MBN RMS functions were observed. Amplitudes of MBN RMS values tended to decrease with increasing deformation. In addition, as the deformation increased, the functions tended to move towards higher current values and the number of peaks in each curve decreased, with only one central peak. For the undistorted specimens, the profiles of the RMS MAE functions showed the appearance of two peaks. The separation of these peaks for the undistorted samples was greater than for the deformed samples.
Acknowledgement
The authors gratefully acknowledge Dr. Linilson Rodriguez Padovesi, Director of "Department of Mechanical Engineering, Polytechnic School, University of Sao Paulo, USP", Sao Paulo, Brazil, for his support on the tests carried out in Brazil, and our very rich discussions.
The authors also acknowledge Dr. Rosa Piotrkowski for the English review and for her important contributions in the revision of this work.