"Goldberg Validations": Refractometric Protein Concentration Calibration of Pooled Source Plasma and Validation of Clinical Serum Protein Refractometers
International Journal of Industrial and Operations Research
(ISSN: 2633-8947)
Volume 3, Issue 1
Research Article
DOI: 10.35840/2633-8947/6512

Article Formats
"Goldberg Validations": Refractometric Protein Concentration Calibration of Pooled Source Plasma and Validation of Clinical Serum Protein Refractometers
Table of Content
Figures
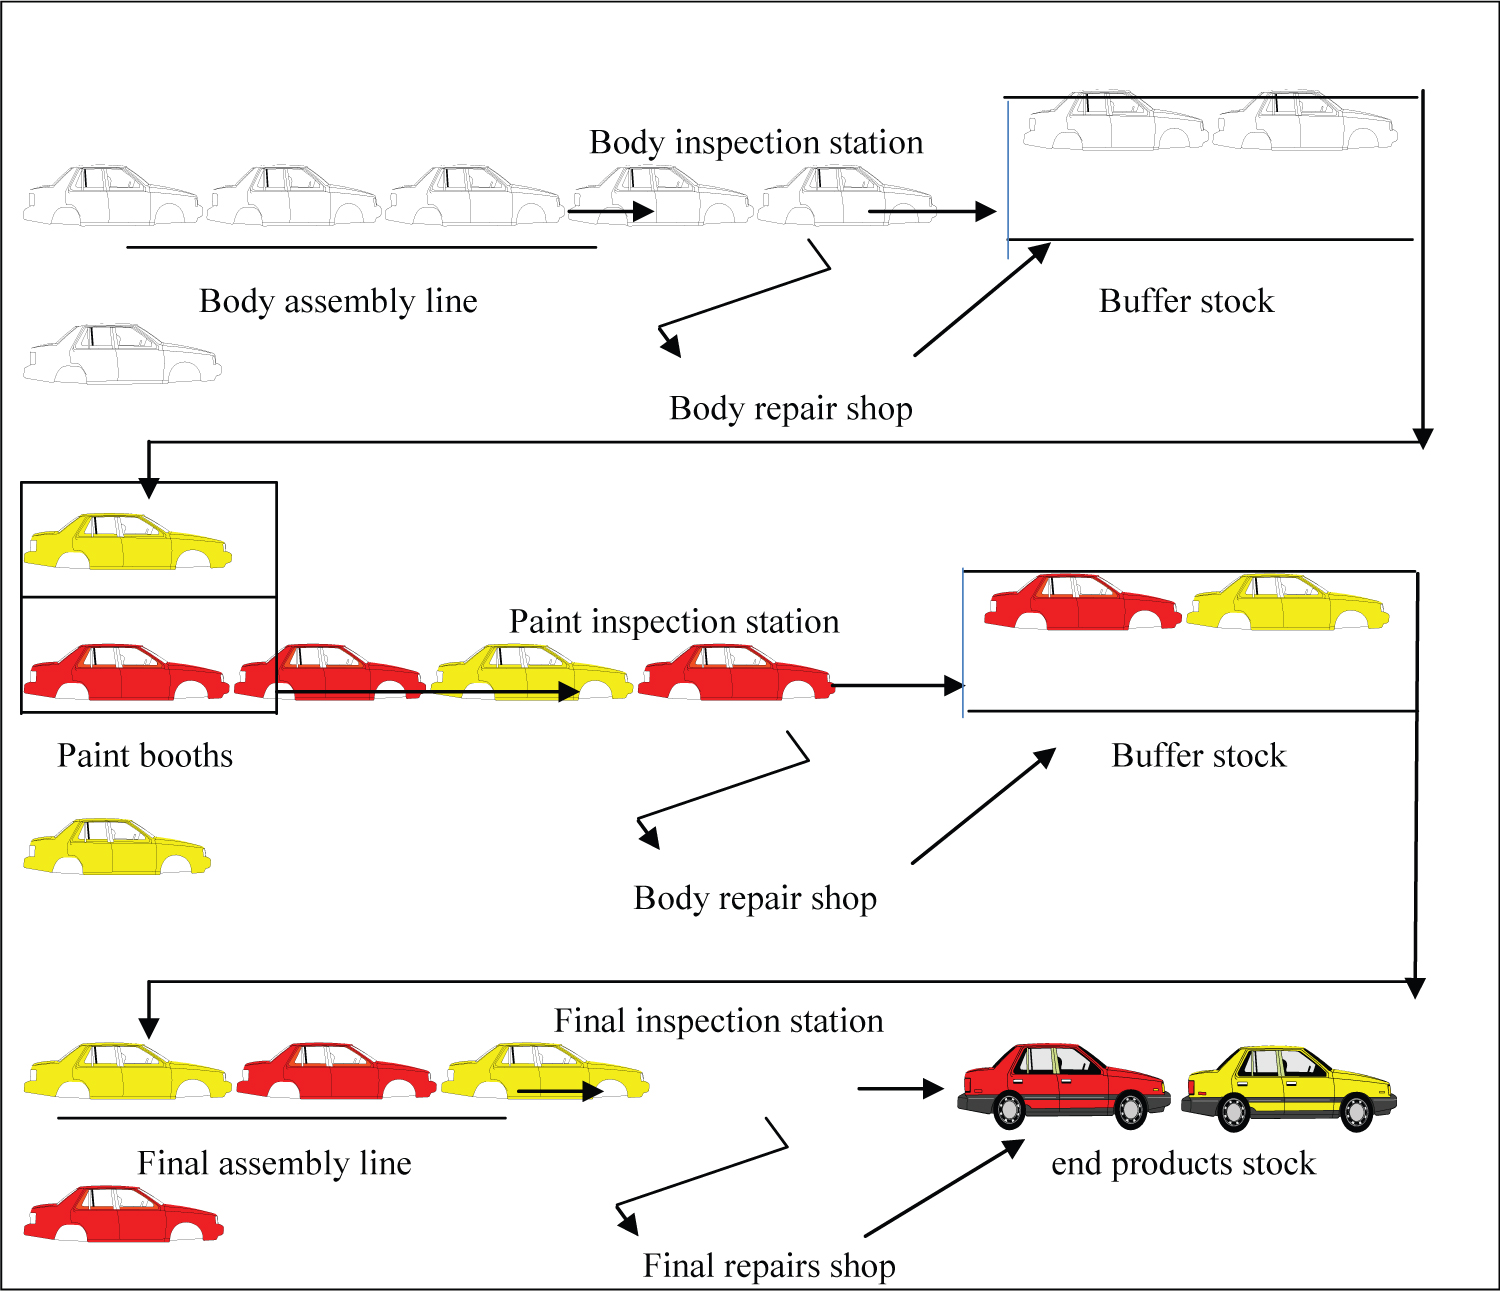

Figure 2: Rank change depends on repair.....
Rank change depends on repair time of the car and repair time of its neighbours.
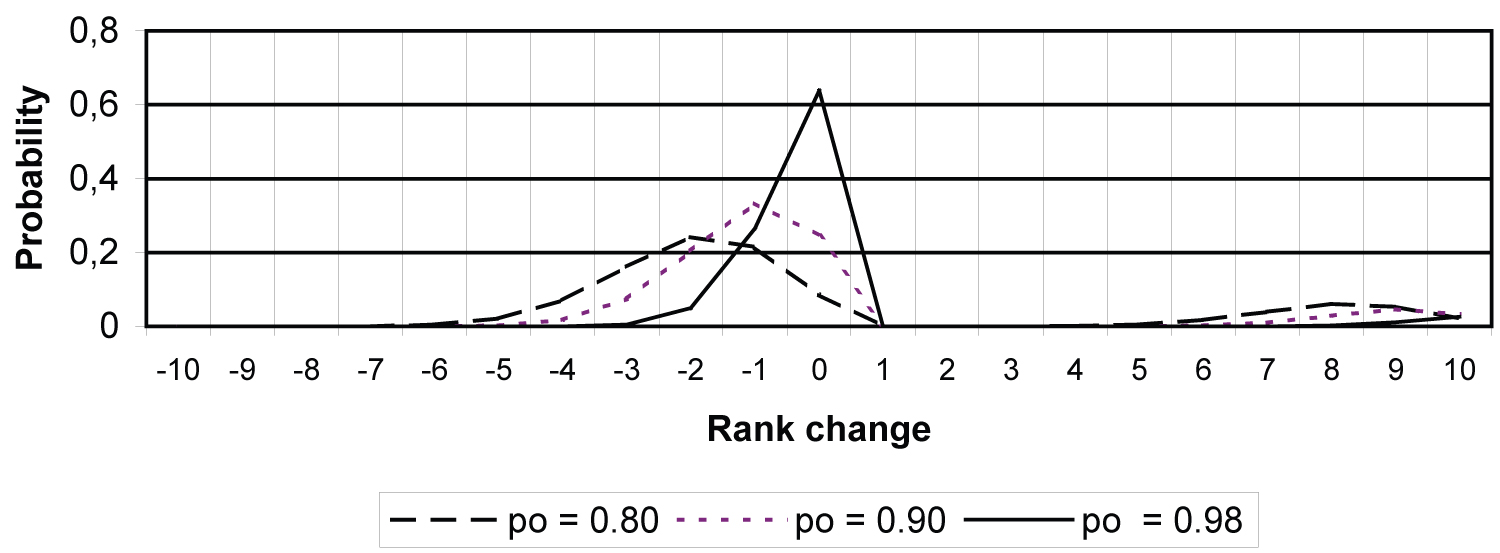
Figure 3: Probability density function....
Probability density function P(Δ = δ) in case of identical repair times.
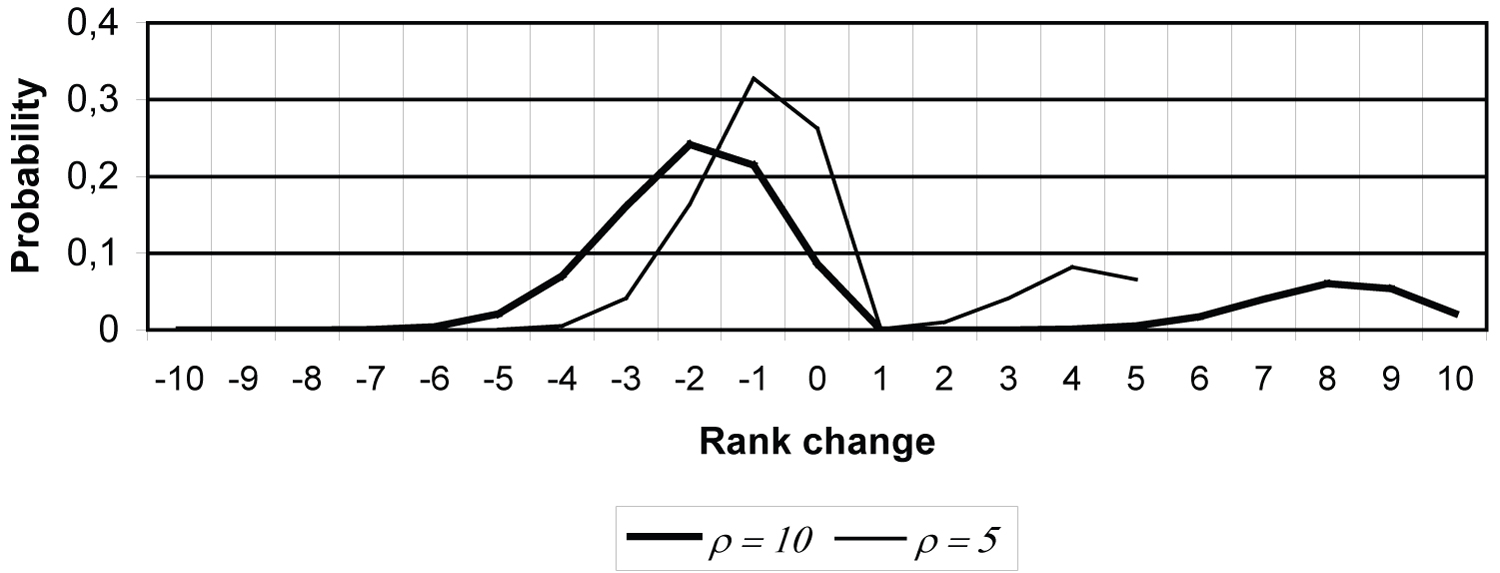
Figure 4: The simplified probability....
The simplified probability distribution P(Δ = δ) as a function of ρ (po = 0.98).
Tables
Table 1: The probability P(Δ = δ) for ρ = 10.
Table 2: The simplified probability distribution P(Δ = δ) as a function of ρ.
Table 3: The probability of having more than S cars in repair.
Table 4: The probability density function P(Δ = δ) in the general case.
Table 5: Conditional probability P(R = r/R > 0).
References
- Danjou F, Giard V, Roy E Le (2000) Analyse de la robustesse des ordonnancements/ré-ordonnancements sur ligne de production et d'assemblage dans l'industrie automobile. Revue Française de Gestion Industrielle 19: 17-36.
- Sivasankaran P, Shahabudeen P (2014) Literature review of assembly line balancing problems. International Journal of Advanced Manufacturing Technology 73: 1665-1694.
- Jiao YL, Jin HQ, Xing XC, Li MJ (2021) Assembly line balancing research methods, literature and development review. Concurrent Engineering Research and Applications 29: 183-194.
- Jackson JR (1956) A computing procedure for a line balancing problem. Management Science 2: 261-271.
- Thomopoulos NT (1967) Line balancing - sequencing for mixed model assembly. Management Science 14: 59-75.
- Thomopoulos NT (1970) Mixed-model balancing with smoothed station assignments. Management Science 19: 593-603.
- Chakravarty AK, Shtub A (1985) Balancing mixed model lines with in process inventory. Management Science 31: 1161-1174.
- Bolat A, Savsar M, Al-Fawzan M (1994) Algorithms for real-time scheduling of jobs on mixed model assembly lines. Computers Operations Research 21: 487-498.
- Gokcen H, Erel E (1997) A goal programming approach to mixed model assembly line balancing problem. International Journal of Production Economics 48: 177-185.
- Gokcen H, Erel E (1998) Binary integer formulation for mixed model assembly line balancing problem. Computers & Industrial Engineering 34: 451-461.
- Matanachai S, Yano CA (2001) Balancing mixed-model assembly lines to reduce work load. IIE Transactions 33: 29-42.
- Bukchin Y, Rabinowitch (2006) A branch-and-bound based solution approach for the mixed-model assembly line-balancing problem for minimizing stations and task duplication costs. European Journal of Operational Research 174: 492-508.
- Haq AN, Zayaprakash J, Rengarajan K (2006) A hybrid genetic algorithm approach to mixed-model assembly line balancing. International Journal of Advanced Manufacturing Technology 28: 337-341.
- Simaria AS, Vilarinho PM (2009) 2-ANTBAL: An ant colony optimization for balancing two-sided assembly lines. Computers & Industrial Engineering 56: 489-506.
- Ozcan U, Cercioglu H, Gokcen H, Toklu B (2010) Balancing and sequencing of parallel mixed-model assembly lines. International Journal of Production Research 48: 5089-5113.
- Ozcan U, Gokcen H, Toklu B (2010) Balancing parallel two-sided assembly lines. International Journal of Production Research 48: 4767-4784.
- Inman RR, Bulfin RL (1991) Sequencing JIT mixed-model assembly lines. Management Science 37: 901-904.
- Solnon Ch, Cung VD, Nguyen A, Artigues CH (2008) The car sequencing problem: Overview of state-of-the-art methods and industrial case-study of the ROADEF'2005 challenge problem. European Journal of Operational Research 191: 912-927.
- Estellon B, Gardi F, Nouioua K (2008) Two local search approaches for solving real-life car sequencing problems. European Journal of Operational Research 191: 928-944.
- Ribeiro CC, Aloise D, Noronha TF, Rocha C, Urrutia S (2008) A hybrid heuristic for multi-objective real-life car sequencing problem with painting and assembly line constraints. European Journal of Operational Research 191: 981-992.
- Sun H, Fan S (2018) Car sequencing for mixed model assembly lines with consideration of changeover complexity. Journal of Manufacturing Systems 46: 93-102.
- Lesert A, Alpan G, Frein Y, Noiré S (2011) Definition of spacing constraints for the car sequencing problem. International Journal of Production Research 49: 963-994.
Author Details
Fayez F Boctor1*, François Danjou2 and Vincent Giard3
1CIRRELT, Université Laval, Québec, Canada
2École Nationale Supérieure d'Ingénieurs de Caen, France
3LAMSADE, Université Paris Dauphine, France
Corresponding author
Fayez F Boctor, CIRRELT, Université Laval, Québec, Canada.
Accepted: December 21, 2021 | Published Online: December 23, 2021
Citation: Boctor FF, Danjou F, Giard V (2021) Rank Change Probability Distribution in Mixed Model Production/Assembly Lines and Impact. Int J Ind Operations Res 4:012
Copyright: © 2021 Boctor FF, et al. This is an open-access article distributed under the terms of the Creative Commons Attribution License, which permits unrestricted use, distribution, and reproduction in any medium, provided the original author and source are credited.
Abstract
Modern mixed-model production/assembly lines contain several inspection stations and the quality control tests made at such stations may lead to sending the tested unit to an off-line rework shop in order make the necessary repair operations before reinserting the unit back in the line. Consequently, the order (sequence) at which processed units leaves the production/assembly line is different from its initial entering order. The consequences of these sequence or rank changes are quite important on the efficiency and balancing of mixed-model production lines such as motorcar assembly lines. In this paper we derive the probability density function of the rank change of a given unit. Having the exact form of this function is a prerequisite for a better and complete analysis of this rank change phenomenon, of its impact as well as for the design of efficient solutions to avoid its disruptive effects.
Keywords
Mixed-model assembly line, Motorcar industry, Probability analysis
Introduction
Modern quality standards and quality requirements make it necessary to add a number of inspection or quality control stations to most production/assembly lines with large number of work stations. There are two possible outcomes of an inspection operation in such a context. Either the inspected unit passes the inspection test and goes to the next workstation of the assembly line, or it fails the test, which implies that this unit should be withdrawn and send to a rework shop or a rework line to be repaired. Afterwards, the unit returns to the main line. The unit is brought back either to the inspection station that sent it for repairs or to the following workstation. This depends on whether an equivalent inspection is done in the repair shop or not. In many cases, it is required that the unit under repair does not leave the repair shop until it is re-inspected and passes the inspection tests that caused its withdrawal from the main production/assembly line.
In a mixed-model production line, different product models are introduced to the line according to a predetermined sequence, which gives to each unit or model a rank in the sequence. This sequence is determined in a way that maximizes the efficiency of the line. The withdrawal and return of a unit imply a rank change for this unit as well as for some other units. Thus, in general, the final sequence is different from the initial sequence. Generally, this reduces the line efficiency and its balance.
If no other unit is withdrawn until the return of this unit, it will lose a number of positions in the sequence that depends on the repair time of the unit and the cycle time of the main production/assembly line. But, if some of the preceding and/or succeeding units are also withdrawn and require more repair time than our unit, the new position of the unit is different of its old one. This rank change phenomenon is of interest for many industries that use mixed-model production/assembly lines particularly for the car manufacturing industry. That is why we will focus hereafter on the impact and the analysis of this problem in this industry.
Problem Description
It is a usual practice to have a buffer stock after each inspection station (see Figure 1). This is needed to prevent line stoppage when a car is withdrawn for repairs and also allows re-sequencing the flow in order to overcome some of the negative effects of sequence or rank changes. These effects will be discussed later but let us first give the definition of some terms that will be used in this paper. We define the rank of a car under assembly at the entrance of a given production/assembly line as its position in the production sequence at this entrance point. Thus, the initial rank of a car is its order number or position in the sequence at the entrance of the first workstation of the assembly line. Similarly, the final rank of a car is its rank at the entrance of the final stocking area at the end of the line. The difference between the rank of a given car at a workstation B and its rank at a preceding workstation A, will be referred to as the rank change of this car between A and B. The overall rank change is the difference between the final rank at the final work station of the line and the initial rank at its first work station. A rank change could be positive, negative or nil. A positive rank change (called lag) means that the car will come out of the line later than initially planned and a negative rank change (called advance) means that it will come out earlier.
Obviously, there are no rank changes between a workstation A and a following workstation B if there is no inspection station in between and no withdrawal is allowed over this line segment. The rank change of a given car at a given inspection station, which is measured by the difference between its rank at the entrance of the following workstation and its rank at the entrance of the given inspection station, depends not only on what happens to this car but also on what happens to some of the succeeding and preceding cars.
Figure 2a shows that if the car in the ith position fails the inspection test losing k positions (due to its repair time), and all the other cars pass the test, then each of the cars in positions i + 1, ..., j, ..., i + k will get a negative rank change (advance) of 1 position (i.e., moves forward one position). Figures 2b presents a situation where the car in position i needs repairs that requires a time equivalent to the time of k line cycles but loses only k-1 positions (positive rank change of k-1) as the car in position i + j (with j < k) requires repairs for more than k-j cycles (in the figure it require k-j + 1 cycles).
The consequences of rank changes are discussed in detail in Danjou, et al. [1]. Hereafter we give a short discussion of these consequences. But to better understand rank changes effects, let us recall that modern assembly lines generally adopt a just-in-time policy for the delivery of components to the line. Also notice that the initial production sequence is mainly made in a way that uniformly disperses the cars having a component requiring large installation time. In cars assembly facilities, this is usually called the "model or option spacing constraint". Uniformly spacing cars that require higher operations time at a given workstation helps the workers at this station to follow the line pace. Actually, a car requiring more time than the line cycle time, is followed by a sufficient number of cars that require less time than the cycle time, then the line balance will be improved.
Rank changes have two main effects. First, the just-in-time, components-supply plan, which is established based on the initial production sequence, can no longer guarantee the continuous functioning of the line. Some components will stay longer before they are used and some others will not be available when needed. Consequently, rank changes force the holding of a larger safety stock of components. Second, rank changes make it harder for some workstations to keep up the pace. Consequently, additional workers should be sent to such workstations from time to time in order to help rebalance the line.
In this paper we study the following important and fundamental problem. Given the probability density function of R, the number of cycles a car needs for repairs (R depends directly on repair times and the line cycle-time), determine the probability density function of Δ, the rank change between the entrance to an inspection station and the entrance to the following station. Thus we seek to determine P(Δ = δ) as a function of P(R = r).
Also, we provide a preliminary analysis of some related problems such as the determination of the size of the buffer stock that follows an inspection station, how to determine the probability distribution of rank changes for lines with multiple inspection stations, and how to organize the rework line or the rework shop.
Obviously, determining the form and parameters of the probability density function of Δ is a prerequisite for a precise analysis of the economic impact of or rank changes. In other words, knowing the form and parameters of the probability function of rank changes, P(Δ = δ), is needed to calculate the resulting increase in components safety stock and the resulting increase in work force cost. In addition, knowing the form and the parameters of this function is also necessary if we want to evaluate the impact of a specific action to improve the production process. This is because production process improvements should lead to a modification of the probability density function P(R = r), and consequently, will modify the function P(Δ = δ).
The form and parameters of the function P(Δ = δ) can be found empirically by simulation. This is the only available method if the exiting rule from buffer stock, between the inspection station and the following workstation, is not a "first in first out (FIFO)" rule (see Danjou, et al. [1]). Hereafter, we assume that the flow through this buffer stock is FIFO and we shall derive the exact form of P(Δ = δ). Knowing the exact analytical form of this function should be much more helpful than just having an approximate empirical form if we need to study the response of the manufacturing system to any improvement action.
In addition to the above-mentioned assumptions, we also assume that:
1. The repaired cars do not come back to the main line until all the defects that caused their withdrawal are completely corrected. When they return, they are directly inserted into the buffer stock that follows the inspection station.
2. The number of cars in this buffer stock is sufficiently large to prevent any line stoppage due to withdrawal of cars. Actually, to prevent such line stoppage, the number of cars to place in the buffer stock should equal ρ, the maximum number of cycles that a car may need for repairs. However, we may accept placing fewer cars in the buffer if we can accept a limited probability of line stoppage. This point will be studied in more detail in section 5.
3. There is complete independence between the event "a car needs repair" and the event "the following car needs repair".
4. The rework line or shop has sufficient capacity. Consequently, there is no waiting time in this shop or line. The repair time depends only on the needed repairs and does not depend on the number of cars under repair.
5. The production/assembly line is in a steady state. We are not studying the transition state of the line.
Literature Review
Although several contributions to mixed-model production/assembly line problems have been proposed in the literature over the last five decades, to the best of our knowledge, the rank change problem and its economic impact have never been the subject of any publication.
The assembly line problem that received the greatest attention in the literature is the line balancing problem. Recently, Sivasankaran and Shahabudeen [2] presented an extensive review of the line balancing literature. Also, Jiao, et al. [3] proposed a review of 89 recently published papers. They divided the line balancing problems into three subproblems according to the number of models produced by the assembly line. These three subproblems are the single-model, the mixed-model and multiple-model assembly line balancing problems. Jackson [4] proposed one of the first enumeration methods designed to solve small single-model line balancing problem. Thomopoulus [5,6] showed how to adapt single-model balancing methods to solve the mixed-model balancing problem. Chakravarty and Shtub [7] designed an algorithm to assign tasks to work stations in a way that minimizes the total production cost. Bolat, et al. [8] studied the problem of real-time line rebalancing where such rebalancing is needed. Gokcen and Erel [9] presented a goal programming formulation of the problem and Gokcen and Erel [10] developed a binary integer formulation for the mixed-model assembly line balancing problem in which the number of stations is minimized for given cycle time. Matanachai and Yano [11] proposed a method to assign tasks to stations that provide stable workloads. Bukchin and Rabinowitch [12] proposed a branch-and-bound algorithm that can solve this same problem.
In addition, many heuristics and metaheuristics were designed to solve the mixed-model line balancing problem. Haq, et al. [13] developed a hybrid genetic algorithm to solve the problem in which the objective is to minimize the number of workstations for a given cycle time. Simaria and Vilarinho [14] presented an ant colony optimization algorithm to balance the two-sided mixed-model problem with the objective of minimizing the number of work stations for a given cycle time. Ozcan, et al. [15] developed a simulated annealing algorithm to minimize the number of workstations while equalizing stations work load. Also, Ozcan, et al. [16] proposed a Tabu search algorithm to balance two or more two-sided mixed-model assembly lines.
Another widely studied problem in the assembly line literature is the mixed-model sequencing problem. This problem consists of sequencing a given set of models to be produced in each day. Inman and Buffin [17], and Danjou, et al. [1] studied this problem and proposed methods to solve it.
More recently, Solnon, et al. [18] presented a review of exact and heuristic methods proposed to solve the standard mixed-model sequencing problem. Estellon, et al. [19] presented a very fast local search method that won the ROADEF' 2005 challenge where real-life car sequencing problems proposed by the car manufacturer RENAULT was solved. The second winners of this challenge were Ribeiro, et al. [20] who designed a set of heuristics based on variable neighbourhood and iterated local search concepts. Afterwards, Sun and Fan [21] proposed a lexicographic approach based on ant colony optimization to solve a bi-objective version of the car sequencing problem. The first objective is to minimize the number sequencing rules violation and the second one is minimizing a criterion they proposed and called changeover complexity. Sequencing rules, also called spacing constraints, are discussed in Lesert, et al. [22].
The organization of this paper is as follows. In section 4, we analyse the rank change problem under the special assumption of identical repair time for all cars. In section 5 we discuss some related problems such as how to determine the size of the buffer stock that follows an inspection station, how to determine the probability distribution of rank changes for lines with multiple inspection stations, and how to organize the rework line or the rework shop. In section 6, we generalize the model to consider the case where cars may have different repair times. Section 7 deals with the question of how to model the case where cars may require more than one visit to the repair shop. Finally, the conclusions of this research are drawn in section 8.
A Simplified Rank-Change Probability Function
Let us consider the simplified situation where R, the number of cycles required for repairs, takes either the value 0 (the car passes the inspection test) or a fixed value ρ. This means that the repair time is the same for all cars that fail the inspection test. This situation occurs for example if the repairs are done on a paced parallel line with a fixed number of workstations.
Let us also assume that the rework shop will repair all defects and consequently a repaired car will always be able to pass the inspection test with success. Thus, a repaired car will be sent to the buffer stock following the inspection station and will not be sent back to the inspection station. In the next section we will show how to deal with the case where we cannot make this assumption, i.e., how to deal with the case where a car requires several visits to the repair shop or the repair line before it becomes acceptable.
Under the above assumptions, the car in position j either passes the inspection and immediately enters the buffer stock or fails the test and is sent to the rework line to come back and enters the stock ρ cycles later. When it comes back, its position in the sequence depends on x, the number of cars, among the succeeding cars (those originally in positions j + 1 through j + ρ, that failed the inspection test. Precisely its new position will be j + ρ-x and, in this case, its rank change δ = ρ-x.
Rank change δ is negative (the car moves to a forward position), nil, or positive (the car moves to a backward position). Rank change is negative (δ < 0; also called position advance) if the car passes the inspection and x of the preceding δ cars (those in positions j-ρ to j-1) fail (R = 0 and x > 0). Rank change is nil (δ = 0) if R = 0 (the car passes) and x = 0 (no one of the preceding ρ cars fail) or if R = ρ (the car fails) and x = ρ (all the succeeding ρ cars fail). Finally, rank change is positive (δ > 0; also called position lag) if R = ρ and some but not all the succeeding cars fail the inspection (x < ρ).
Let po be the probability that a given car passes the inspection, X stands for the random variable indicating the number of cars among ρ successive cars that fail the inspection, and P(X = x) the probability that exactly x among ρ successive cars fail the inspection. Then we have P(R = 0) = po , P(R = ρ) = 1-po and . Recall that we assumed that the events "a car fails the test" and "the succeeding car fails the test" are independent; thus P(X = x) is a binomial distribution.
It is easy to see that if R = 0, which has a probability P(R = 0) = po, and if x > 0, which has a probability , we obtain a negative rank change (δ < 0) with a probability . Also, R = ρ, which has a probability P(R = ρ) = 1-po, and ρ > x ≥ 0, which has a probability , leads to a positive rank change (δ > 0) with a probability . Finally, the probability P(Δ = 0) equals the sum of P(R = 0).P(X = 0) and P(R = ρ).P(X = ρ). Thus In summary we have:
As an illustration, Table 1 gives the probability P(Δ = δ) for ρ = 10 and some values of po ranging from 0.80 to 0.98. Figure 3 gives the general form of this probability density function. This figure shows that P(Δ = δ) is, in general, not symmetrical. This can be explained by examining the probability function. It implies that while and if we agree that po have in general a value larger than 0.50, we can see that P(δ < 0) is generally higher than P(δ > 0). However, this probability density function becomes symmetrical in the case where po = 0.50.
Table 2 and Figure 4 show the effect of ρ on the probability P(Δ = δ) for a given value of po (po = 0.98). Obviously, the standard deviation of rank changes decreases as ρ decreases.
Preliminary Analysis of Some Rework Related Issues
In this section we study three issues related to the rework and rank changes: (1) The determination of the size of the buffer stock that follows an inspection station, (2) How to determine the probability distribution of rank changes for lines with multiple inspection stations, and (3) How to organize the repair line or the repair shop.
Buffer size
As mentioned an inspection station is usually followed by a buffer stock. This is essential to avoid line stoppage if a car is withdrawn for repairs. Instead of sending the cars that pass the inspection directly to the following station, we send them to a buffer stock that is used to feed the following station. Assuming that the assembly line is in a steady state, then the number of cars in the buffer at any moment equals the maximal number of cars that the buffer can hold minus the number of cars in the rework line or shop at that moment. So, to avoid line stoppage, the buffer size should be larger than or equal to the maximum number of cars that could be found in the rework line or shop at any moment. Under our assumptions, it is easy to see that this number equals the maximum number of cycles a car may need for repairs. Thus, to never empty the buffer, which leads to line stoppage, the size of the buffer should equal ρ, the maximum number of cycles a car may need for repairs.
We have to mention that the buffer stock is also needed to avoid stoppage of the downstream part of the line (stations following the buffer stock) if the up-stream part of the line (the part preceding the buffer) stops as a result of any technical problem or any material supply problem. Hereafter, we deal only with line stoppage because of cars withdrawal for repairs.
Holding a large number of cars in the buffer leads to an increased inventory holding cost. But as the probability that ρ cars be simultaneously in repair is quite small, we may decide to hold a smaller number of cars, say S, in the buffer stock. This decision should be made taking into consideration the inventory holding cost and the cost of stopping the line. This later cost mainly depends on the probability of having more than S cars withdrawn for repairs. But as shown in the previous section, P(X = x), the probability that x among ρ cars fail the inspection test, is given by a binomial probability function. Consequently, the probability of having more than S cars withdrawn at a given moment, noted P(X > S) can be obtained by:
Table 3, gives some values of P(X > S) for ρ = 10 and po ranging from 0.80 to 0.98. This table shows that for ρ = 10 and po = 0.96 the probability of having more than 2 cars in repair is only 0.62%. For the same value of ρ but with po = 0.80, the probability of having more than 5 cars in repair is almost at the same level (0.64%).
Lines with multiple inspection stations
Let us consider a mixed model production/assembly line with m inspection stations and assume that each of these stations is followed by a buffer stock of sufficient capacity to prevent any line stoppage. Also, we assume that the flow rule through these buffers is FIFO (no re-sequencing is done) and complete independence between the events (pass or fail) at different inspection points. Then the probability density function of the overall rank change between the initial and final sequence can be determined easily as the overall rank change δ will be the sum of successive rank changes δ1, δ2, ..., δm. The probability density function is the sum of m binomial functions, which, based on the central limit theorem and assuming that m is sufficiently large, can be approximated by a normal probability density function.
Organization of rework activities
We have mentioned that rework is usually done either in a paced secondary line with a number of workstations or in a repair shop with a sufficient number of parallel and identical repair stations. In this second case each car is assigned to one and only one rework station, which will perform all the necessary repairs. The number of repair stations should be sufficiently large in order to avoid waiting times. This implies that, in order to be able to repair cars as soon as they arrive in the repair shop, the number of parallel stations should be greater than or equal to ρ, the maximum number of cars that could be found in the repair shop simultaneously. However, we may decide to use a fewer number of repair stations, say S stations. Then the probability that a car will wait for repairs equals the probability P(X > S). This probability can be determined as shown in the previous section.
Furthermore, the rework shop can be considered as a queuing system with S parallel and identical servers. This allows us to determine the average waiting time and the average sojourn time.
A General Rank-Change Probability Function
In section 4 we derived the probability density function of rank changes in the simple case where R, the number of cycles required to perform the necessary repairs, takes either the value 0 or ρ. In this section we consider the case where R can take any integer value between 0 and ρ. In such a case, the rank change δ, for the car in position j and requiring r cycles for its repairs, will be r-x where x is the number of cars with an initial rank between j + r-1 and j + r-ρ that are withdrawn for repairs and reintroduced in the main line after the considered car.
As δ = r-x, 0 ≤ r ≤ ρ and 0 ≤ x ≤ ρ, then - ρ ≤ δ ≤ ρ. Also, it is obvious that the same rank change δ can be the result of a number of combinations of r and x. For example, a positive rank change value δ can be obtained by any value of r in the range δ ≤ r ≤ ρ and x = r-δ. On the other hand, a negative rank change δ can be obtained by any value of r in the range 0 ≤ r ≤ ρ-δ and x = r + δ. Thus, to generalize, a rank change δ (positive or negative) can be obtained by any value of r in the range max (0,δ) ≤ r ≤ min (ρ, ρ + δ) and x = r-δ.
Consequently the probability P(Δ = δ) can be calculated by:
As P(R = r) is known, to calculate the probability P(Δ = δ) we need to calculate the probability P(X = x). This is more complicated. In the following we start by showing how to calculate the probabilities P(X = 0), P(X = 1), P(X = 2) and P(X = 3). Then, by induction, we derive the general formula for P(X = x).
Recall that we are considering the car in position j and our objective is to calculate the probability that x among the cars in positions between j + r-1 and j + r- ρ come back to the line behind the considered car. Let the probability that the car in position j + r-i require less than i cycles for its repairs be noted P(Rj + r-i < i).
The probability P(X = 0)
In this case none of the cars in positions between j + r-1 and j + r-ρ come back after the car having the initial position j. The probability of this combined event is:
P(X = 0) = P(Rj + r-1 < 1). P(Rj + r-2 < 2). ... . P(Rj + r-ρ < ρ).
But assuming that the probability functions of R for all cars are identical and independent, we can write:
Now putting we can write:
The probability P(X = 1)
In this case only one car among those initially in positions j + r-1 through j + r-ρ come back after the car having the initial position j. All other cars that are withdrawn for repairs come back to the main line in position preceding this car. The probability of this event is:
Again, assuming that the probability functions of R for all cars are identical and independent; then multiplying and dividing each term by P(R < i), we obtain:
Putting and we can write:
The probability P(X = 2)
In this case exactly two of the cars in positions j + r-1 through j + r-ρ come back after the car having the initial position j and all other cars that are withdrawn for repairs come back to the main line in a preceding position. Let these two cars be those in position j + r-i and j + r-k with i < k ≤ ρ. The probability of this situation is:
As before, we assume that the probability functions of R for all cars are identical and independent. Multiplying and dividing each term by P(R < i), we obtain:
Modifying the limits of the first and second summations, we can write:
Which can be written:
Putting and , the formula above becomes:
Now we can rewrite P(X = 1) and P(X = 0). Let N1 = s1 and N0 = 1 then:
and
Notice that we can also write N2 = s1N1-s2N0 = s1N1-1!s2N0.
The probability P(X = 3)
In this case exactly three of the cars in positions j + r-1 through j + r-ρ come back after the car having the initial position j and all other cars that are withdrawn for repairs come back to the main line in a preceding position. Let these three cars be those in position j + r-i, j + r-k and j + r-l with i < k < l ≤ ρ. The probability of this event is:
Here also we assume that the probability functions of R for all cars are identical and independent. Multiplying and dividing each term by P(R < i), we obtain:
Modifying the limits of the three summations, we can write:
Which can be written:
And leads to:
Putting and , the formula above becomes:
Notice that we can write N3 = s1N2-2s2N1 + 2s3N0 = s1N2-2!.s2N1 + 2!.s3N0.
The probability P(X = x)
In this case exactly x cars will come back after the car originally in position j. By mathematical induction we can write:
Where:
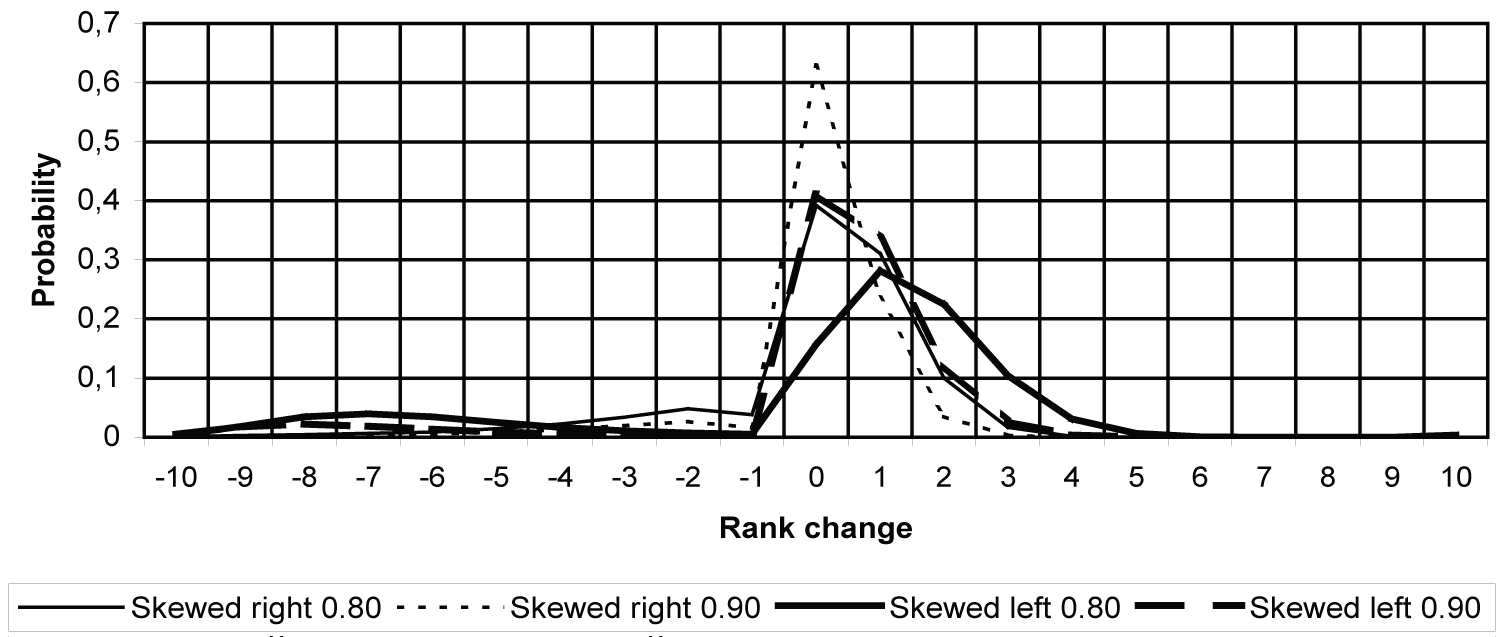
As an illustration, Table 4 and Figure 5 give the probability P(Δ = δ) for four different probability distribution functions P(R = r). For these distributions ρ = 10, po = P(R = 0) is either 0.80 or 0.90 and the conditional probability P(R = r/R > 0) is either skewed to the left or to the right as shown in Table 5.
Repeated Failure to Pass Inspection Tests
To simplify our model, we assumed that each repaired car does not leave the repair shop or line until all the defects that caused its withdrawal from the main line are correctly repaired. In the opposite case where a car fails the inspection several times our results remain valid but we have to use a modified probability function of R.
Consider a car that requires r1 cycles for its first visit to the repair line or shop and requires r2 cycles for its second visit. Assuming that the number of repair cycles of the two visits have the same probability function (i.e., P(R1 = r) = P(R2 = r)∀r), then the probability of requiring a total of r cycles for the two visits (with 2ρ ≥ r ≥ r1) can be obtained by:
In the case where the car requires three visits the probability is given by:
And we can generalize this function in a very classical way to the case of a number of visits v. Then we can derive the probability density function of rank changes (i.e., P(Δ = δ)) using the generalized probability function of R.
Conclusions
In this paper we showed that it is possible to derive and we derived some probability density functions of rank changes in mixed-model production/assembly lines. The results obtained open the door for a more rigorous analysis of the rank changes phenomenon and its economic impact. A preliminary analysis of some of its consequences is provided here but it is obvious that a deeper investigation is needed.
Some of the important questions to study in the future are: what is the probability density function of rank changes after several inspection stations? How to determine the number of inspection stations and what is the optimal position for each one?
Other important issues to study are: the effect of the buffer size and its management policy on the probability of line stoppage; and the probability distribution function of what is called the "ratio of in-schedule cars" or the ratio of cars that are finished in their originally scheduled day. This ratio is used to measure the performance or the efficiency of mixed-model assembly lines.
Acknowledgement
The authors acknowledge the support of Renault for this research project on assembly line performance and the useful help of Etienne Le Roy from "La direction de l'ingénierievéhicule, Renault" who introduced them to this problem.