A Simplified Method for the Determination of Omega-6/Omega-3 Ratios in Red Blood Cells from Human Whole Blood

International Journal of Analytical and Bioanalytical Methods
(ISSN: 2633-8912)
Volume 3, Issue 1
Research Article
DOI: 10.35840/2633-8912/2417

Article Formats
A Simplified Method for the Determination of Omega-6/Omega-3 Ratios in Red Blood Cells from Human Whole Blood
Table of Content
Figures
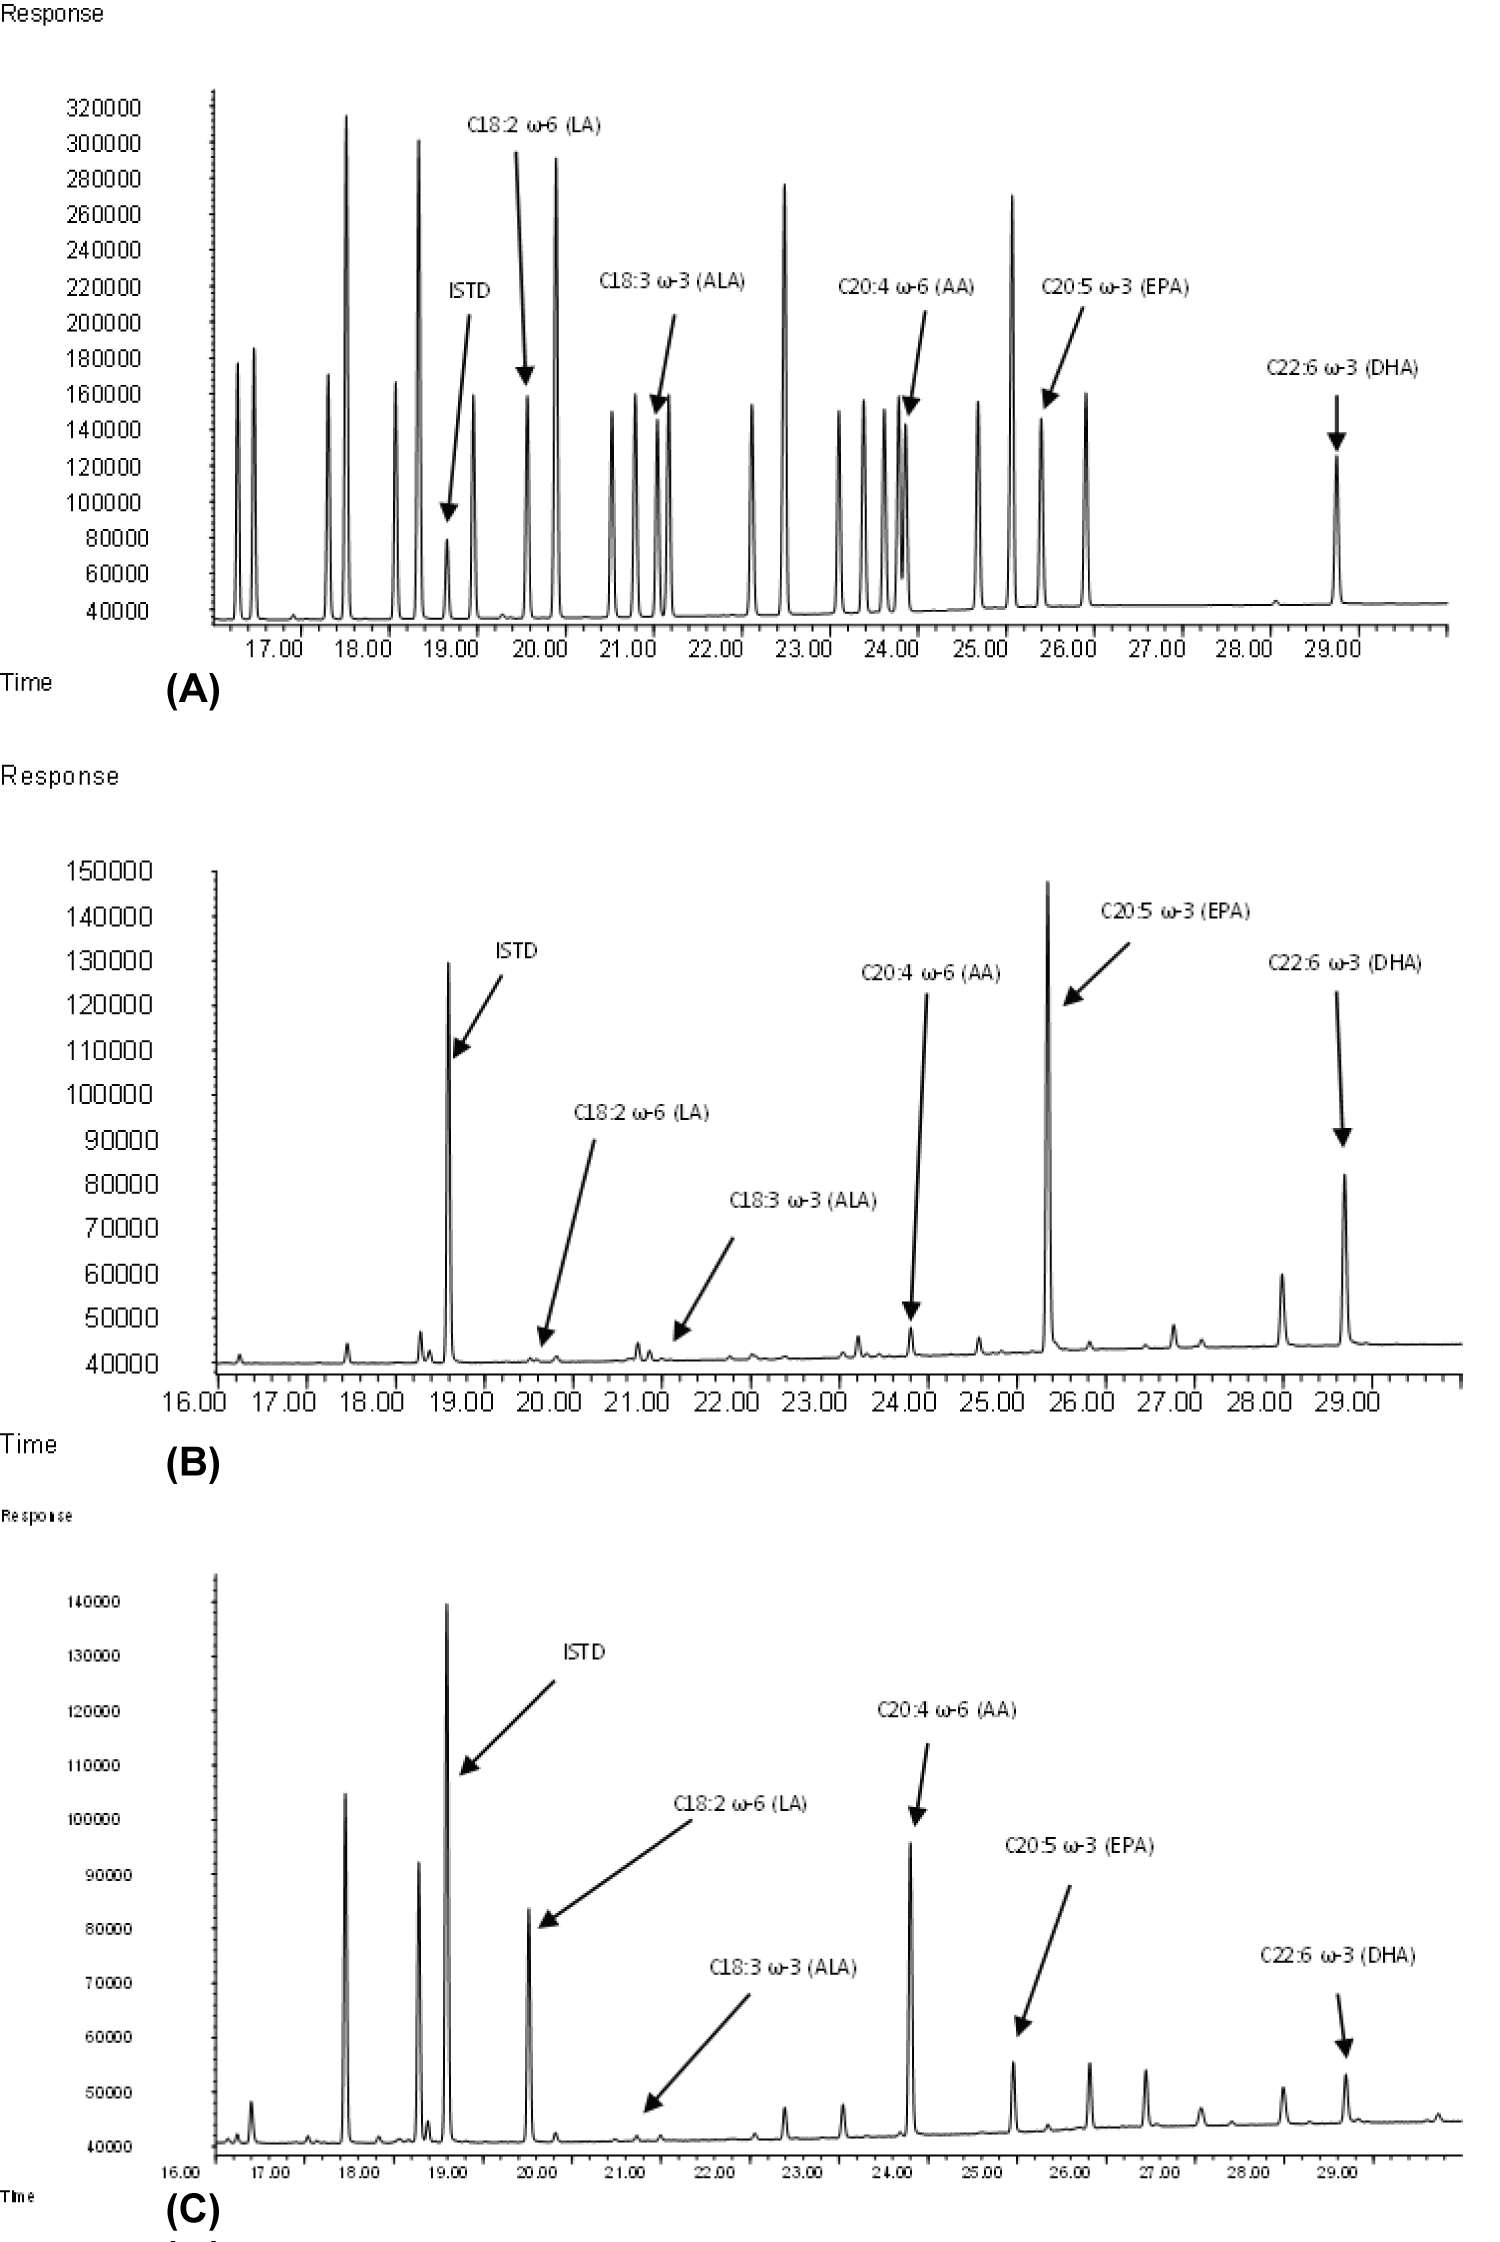
Figure 1: (a) Example Chromatogram (Mid-Range....
(a) Example Chromatogram (Mid-Range Calibration Standard) of the Supelco® FAME 37 mix; (b) Example Chromatogram of the NIST SRM3275-2 standardized fish oil; (c) Example Chromatogram using the composite whole blood sample.
Tables
Table 1: NIST SRM3275-2 (Fish oil standard)- Precision and Accuracy using the NIST fish oil standard, N = 24 over five different days and two different months. The mean ± 2σ represents the 95% confidence interval of measurements in our laboratory. The NIST lower and upper limits, and the NIST target, also represents the 95% confidence interval, but is based on the concentrations listed on the Certificate of Analysis. The upper limit was calculated using the highest denominator and the lowest numerator; the lower limit was calculated with the lowest numerator and highest denominator. The target was calculated simply by adding the values. Values are in µg unless otherwise specified.
Table 2: Composite whole blood sample- Precision using a composite whole blood sample, N = 24 over five different days and two different months. The mean ± 2σ represents the 95% confidence interval. Values are in µg unless otherwise specified.
References
- Rose HG, Oklander M (1965) Improved procedure for the extraction of lipids from human erythrocytes. J Lipid Res 6: 428-431.
- Lepage G, Roy CC (1986) Direct transesterification of all classes of lipids in a one-step reaction. J Lipid Res 27: 114-120.
- Schloss I, Kidd MS, Tichelaar HY, Young GO, O'Keefe SJ (1997) Dietary factors associated with a low risk of colon cancer in coloured west coast fishermen. S Afr Med J 87: 152-158.
- Block RC, Harris WS, Reid KJ, Sands SA, Spertus JA (2008) EPA and DHA in blood cell membranes from acute coronary syndrome patients and controls. Atherosclerosis 197: 821-828.
- Tichelaar HY, Benadé AJ, O'Keefe SJ, Jooste PL, Swanevelder SA, et al. (1992) Plasma lipids and fatty acids in urbanized Bushmen, Hereros and Kavangos of southern Africa (Namibia). Lipids 27: 729-732.
- Simopoulous AP (2011) Evolutionary aspects of diet: The omega-6/omega-3 ratio and the brain. Mol Neurobiol 44: 203-215.
- Bersamin A, Luick BR, King IB, Stern JS, Zidenberg-Cherr S (2008) Westernizing diets influence fat intake, red blood cell fatty acid composition, and health in remote Alaskan Native communities in the center for Alaska Native health study. J Am Diet Assoc 108: 266-273.
- Harris WS (2018) The Omega-6:Omega-3 ratio: A critical appraisal and possible successor. Prostaglandins Leukot Essent Fatty Acids 132: 34-40.
- Harris WS, Luo J, Pottala JV, Margolis KL, Espeland MA, et al. (2016) Red blood cell fatty acids and incident diabetes mellitus in the women's health initiative memory study. PLoS One 11: e0147894.
- Murff HJ, Tindle HA, Shrubsole MJ, Cai Q, Smalley W, et al. (2016) Smoking and red blood cell phospholipid membrane fatty acids. Prostaglandins Leukot Essent Fatty Acids 112: 24-31.
- Fenton JI, Gurzell EA, Davidson EA, Harris WS (2016) Red blood cell PUF as reflect the phospholipid PUFA composition of major organs. Prostaglandins Leukot Essent Fatty Acids 112: 12-23.
- Pekiner B, Pennock JF (1995) Fatty acids in plasma and red blood cell membranes in humans, rats, rabbits and dogs. Biochem Mol Biol Int 37: 221-229.
- Clayton EH, Gulliver CE, Piltz JW, Taylor RD, Blake RJ, et al. (2012) Improved extraction of saturated fatty acids but not omega-3 fatty acids from sheep red blood cells using a one-step extraction procedure. Lipids 47: 719-727.
- Bystrická Z, Duracková Z (2016) Gas chromatography determination of fatty acids in the human erythrocyte membranes - A review. Prostaglandins Leukot Essent Fatty Acids 115: 35-40.
- Manku MS, Horrobin DF, Huang YS, Morse N (1983) Fatty acids in plasma and red cell membranes in normal humans. Lipids 18: 906-908.
- Liu Z, Weng R, Feng Y, Li Z, Wang L, et al. (2016) Fatty acid profiling of blood cell membranes by gas chromatography with mass spectrometry. J Sep Sci 39: 3964-3972.
- Criado-Navarro I, Mena-Bravo A, Calderón-Santiago M, Priego-Capote F (2020) Profiling analysis of phospholipid fatty acids in serum as a complement to the comprehensive fatty acids method. J Chromatogr A 1619: 460965.
- Bielawska K, Dziakowska I, Roszkowska-Jakimiec W (2010) Chromatographic determination of fatty acids in biological material. Toxicol Mech Methods 20: 526-537.
- Carlson SE, Rhodes PG, Rao VS, Goldgar DE (1987) Effect of fish oil supplementation on the n-3 fatty acid content of red blood cell membranes in preterm infants. Pediatr Res 21: 507-510.
- Armstrong JM, Metherel AH, Stark KD (2008) Direct microwave transesterification of fingertip prick blood samples for fatty acid determinations. Lipids 43: 187-196.
- Supelco® (2019) Certificate of analysis. 37 Component Fame Mix, CRM47885, Lot #LRAC3241.
- National Institute of Standards and Technology (2018) Certificate of analysis. SRM3275-2.
Author Details
B Loye Eberhart II*, Annette S Wilson and Stephen J D O'Keefe#
Division of Gastroenterology, Hepatology, and Nutrition, Department of Medicine, University of Pittsburgh, USA
Corresponding author
B Loye Eberhart II, Researcher III, Division of Gastroenterology, Hepatology, and Nutrition, Department of Medicine, University of Pittsburgh, 200 Lothrop Street, Room W1111/2, Biomedical Science Tower, Pittsburgh, PA 15213, USA, Tel: 412-610-6867.
Accepted: November 13, 2021 | Published Online: November 15, 2021
Citation: B Loye Eberhart II, Wilson AS, JDO’Keefe S (2021) A Simplified Method for the Determination of Omega-6/Omega-3 Ratios in Red Blood Cells from Human Whole Blood. Int J Analyt Bioanalyt Methods 3:017
Copyright: © 2021 B Loye Eberhart II, et al. This is an open-access article distributed under the terms of the Creative Commons Attribution License, which permits unrestricted use, distribution, and reproduction in any medium, provided the original author and source are credited.
Abstract
Studies have shown that the ratio of n-6:n-3 fatty acids in red cell membranes provides an objective biomarker of the relative intakes of westernized and traditional diets. Thus, an increase in the ratio is associated with risk for the development of westernized diseases. Whole human blood was analyzed for targeted omega-6 and omega-3 fatty acids. An aliquot was washed with Dulbecco's Phosphate Buffered Saline and centrifuged to form a pellet. The pellet was spiked with an internal standard (n-nonadecanoic acid), digested with hydrochloric acid, and then derivatized with boron trifluoride/methanol (14%) at 100 ℃ to form FAME's (fatty acid methyl esters). The methyl esters were extracted into hexane and analyzed by GC-FID (gas chromatography-flame ionization detection). The targeted analytes were Linoleic Acid (LA-18:2, ω-6), α-Linolenic Acid (ALA-18:3, ω-3), Arachidonic Acid (AA-20:4, ω-6), Eicosapentaenoic Acid (EPA-20:5, ω-3), and Docosahexaenoic Acid (DHA-22:6, ω-6). A ratio was calculated from the sum of these omega-6 fatty acids (FAs) to the sum of omega-3 FAs. Accuracy was 107% as determined by comparison with a standardized fish oil from the National Institutes of Standards and Technology (NIST). The linear dynamic range (LDR) was 10-600 micrograms per gram of fish oil, with a lower limit of detection (LOD) of 2 micrograms per milligram of fish oil, with a signal-to-noise of 3:1.
Keywords
Omega-3, Omega-6, Fatty acids, FAME's, GC, Gas chromatography, Whole blood
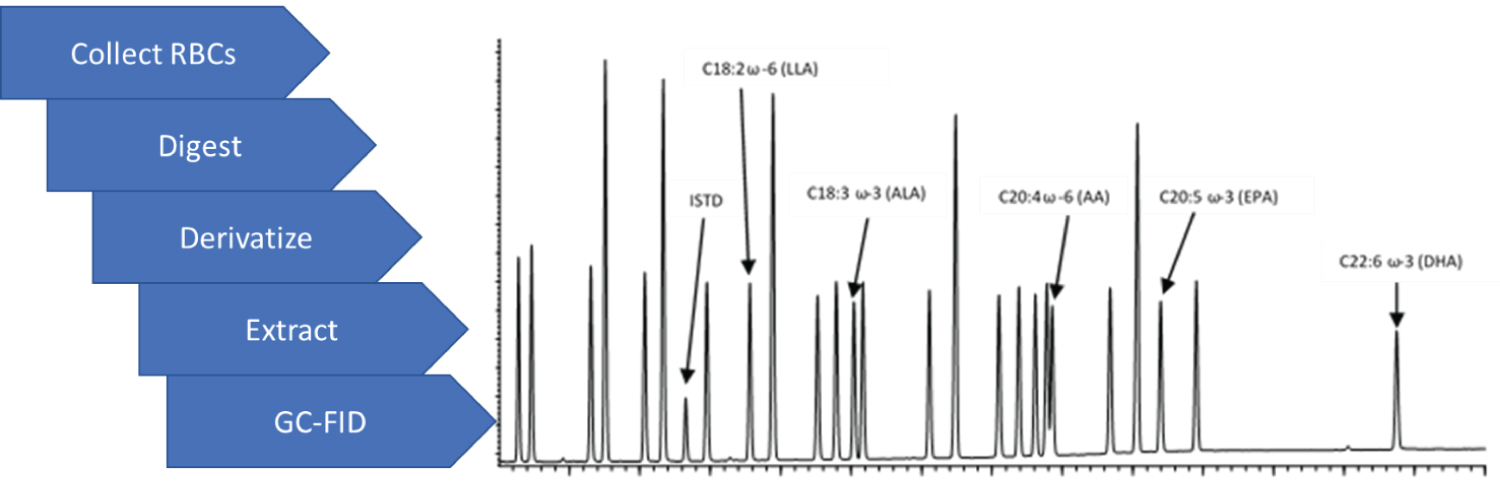
Graphical Abstract
Highlights
• Red blood cell isolation and digestion, plus fatty acid derivatization and extraction, was performed in one tube.
• Extracts were analyzed by GC-FID, using an SP-2560 column, with a run time of just over 30 minutes.
• Analysis provides ω-6/ω-3 ratios relevant to diet for the preceding 30 days.
Introduction
There is good evidence that omega-3 fatty acids are important to human health. Specifically, omega-3 fatty acids have anti-inflammatory properties and thus have coronary benefits and anti-carcinogenic properties, including decreased risk of colon cancer. The presence of such fatty acids in red blood cell membranes is an indicator of dietary habits. A diet rich in plant or fish-based foods result in higher levels of omega-3 fatty acids and lower levels of omega-6 fatty acids; whereas, diets containing large amounts of red meat will have lower levels of omega-3 fatty acids and elevated levels of omega-6 fatty acids [1-20].
Within the general category of these fatty acids, specific omega-3's and -6's have been found to be important indicators. The specific omega-3s are α-Linolenic Acid (ALA-18:3, ω-3), Eicosapentaenoic Acid (EPA-20:5, ω-3), and Docosahexaenoic Acid (DHA-22:6, ω-3); and the specific omega-6s are Linoleic Acid (LA-18:2, ω-6) Arachidonic Acid (AA-20:4, ω-6).
As a result, the ratio of the two are indicators of terrestrial:marine food intake, or westernized to traditional high plant based dietary intakes. Biomarkers are essential in the interpretation of dietary studies based on subjective recalls and questionnaires. Food frequency questionnaires are prone to measurement errors due to their subjective nature and potential for bias. Biomarkers are not memory based and do not require estimation of portion sizes, making them more objective. The use of RBCs has the further advantage as it samples over a long period of time as the half life of RBCs is over 100 days.
Many publications use some, all, or additional fatty acids, as various indicators of health. The fatty acids in red blood cell membranes are phospholipids, as they are liberated from a glycerol phosphate backbone, rather than a simple glycerol backbone, as in fish oil, during transesterification with boron trifluoride/methanol. Various fatty-acid amounts or ratios in blood samples, as well as various analytical techniques, have been employed to characterize dietary habits and used as indicators of human health. For example, Lepage in 1986 [2] used a one hour derivatization with benzene, methanol, and acetyl chloride; Bersamin in 2008 [7] uses Rose and Oklander's method from 1965 [1]; however, Rose and Oklander's technique was not specific to the fatty acids mentioned in this paper. Block in 2008 [4] discusses a boron trifluoride/methanol derivatization, but uses only EPA and DHA as markers for coronary disease. Armstrong in 2008 [20] used a simple method of collecting blood (e.g., fingertip prick; blood aliquot collected with chromatography paper), but required a microwave oven for derivatization.
A standardized fish oil from the National Institutes of Standards and Technology was used to test the accuracy and precision of the derivatization, extraction, and GC-FID analysis.
This paper presents a simplified method for determining this ratio using whole blood samples collected in EDTA tubes.
Material and Methods
Safety: Sample and standard preparations were carried out under a fume hood, including weighing the samples or standards. Safety glasses, with side shields, a lab jacket, and nitrile gloves, were worn at all times. After the procedure, surfaces were sanitized with a 10% bleach solution in water.
Whole blood samples collected in EDTA tubes, were stored at -80 ℃.
Equipment
Apparatus: GC-FID-GC Conditions: Agilent 6890 with 7683 autosampler (Palo Alto, CA, USA); GC Column, Supelco®, SP-2560, 100 m × 0.25 mm ID × 0.2 µm film (Bellefonte, PA, USA); Oven temperature program: 100 ℃ for 1 minute ramped at 25 ℃/minute to 200 C, hold for 8 minutes, then ramp to 250 C at 5 ℃/minute, holding for 6 minutes; carrier gas was helium with a flow of 2.4 mL/min; inlet temperature of 220 ℃ operated in split mode. 5:1 [21].
Detector conditions: Temperature was 250 ℃; air flow was 400 mL/minute; hydrogen flow was 40 mL/minute; makeup gas flow (helium) was 40 mL/minute.
Autosampler conditions: Solvent A and B Washes were methylene chloride, three times, pre- and post-injection; Sample Wash, one time; sample pumps, three times.
Software:
(a) Agilent ChemStation (Version D.01.02.16)
(b) Screw Thread Tubes with Rubber-Lined Cap, Fisherbrand®, 16 × 100 mm, #1495925B (Fairlawn, NJ, USA)
(c) Teflon Liners, Supelco®, 15 mm, #27157 (Bellefonte, PA, USA)
(d) Micropipettes capable of delivering 1-5000 µL, Eppendorf (Enfield, CT, USA)
(e) Transfer Pipettes, 3-mL, Samco, #225 (San Diego, CA, USA)
(f) 100-mL volumetric flasks, 250-mL beakers
(g) Autosampler vials with Teflon/Silicone Septa (Thermo Scientific, #CERT5000-78)
(h) Glass serological pipette, 10-mL, Fisherbrand® (Fairlawn, NJ, USA)
(i) 500-mL Media Bottle with graduations and cap, Pyrex, #1395
Reagents
(a) Hydrochloric Acid, Certified ACS Plus, Fisher, A144 SI-212 (Fairlawn, NJ, USA)
(b) Boron Trifluoride 14% in Methanol, Sigma-Aldrich, B1252-250ML (St. Louis, MO, USA)
(c) DPBS, Dulbecco's Phosphate Buffered Saline (PBS) with Calcium and Magnesium; “PBS”Corning Cellgro®
(Mediatech, Inc.), #21-030-CV, 500 mL (Manassas, VA, USA)
(d) Deionized Water, 18.2 MΩ∙cm @ 25 ℃ (Milli-Q System)
(e) 37 Component FAME Mix, Supelco®, CRM47885 (St. Louis, MO, USA)
(f) Standardized Fish Oil, NIST SRM3275 (Ampule #2), (Gaithersburg, MD, USA)
(g) n-Nonadecanoic Acid (C19:0), Sigma-Aldrich, #72332-5G-F (St. Louis, MO, USA)
(h) Hexane, Fisher, Optima®, H306-4 (Fairlawn, NJ, USA)
(i) Methylene Chloride, Fisher, Optima®, D151-4 (Fairlawn, NJ, USA)
Solutions and standards
Preparation of tubes: Teflon liners were inserted into the caps of the tubes before use. The caps were screwed onto the tubes to ensure a flush fit against the inside of the cap.
Preparation of saturated sodium chloride solution: To a media bottle, 400 mL of deionized water was added using the graduations on the bottle, and then 160 g NaCl was added. This solution was allowed to stand at room temperature for one hour with occasional vigorous shaking.
(The solution was capped and refrigerated (4 ℃) when not in use. Before use, the solution was allowed to come to room temperature and then rehomogenized).
Preparation of Internal Standard (ISTD) stock: Nonadecanoic acid, 0.05 g, was weighed into a vial, the weight recorded to four-decimal places, and then transferred quantitatively with hexane to a 100-mL volumetric flask. Methylene chloride, 25 mL, was added to the flask, the compound was allowed to dissolve completely with gentle swirling, and then diluted to volume with hexane. The solution was homogenized after stoppering.
A 60-µL aliquot of this solution was added to each standard and sample. This yielded a nominal amount of 30 µg. (The actual amount was calculated to four-decimal places).
(This solution was stoppered and refrigerated (4 ℃) when not in use. Before use, the solution was allowed to come to room temperature and then rehomogenized).
Preparation of calibration standards: The following volumes of the FAME 37 Mix were added to separate culture tubes: 5, 75, 150, 225, and 300 µL. These volumes correspond to 1, 15, 30, 45, and 60 µg of the analytes, respectively. Then, 60 µL of the ISTD stock was added to each tube. The solvent was evaporated by placing the tubes in a 100 ℃ heating block for a minute or two. Next, 2 mL of boron trifluoride-methanol was added with a transfer pipette. The tubes were capped tightly and heated at 100 ℃ for 10 minutes, with occasional shaking. Afterwards, the tubes were allowed to cool to room temperature, the caps removed, and 2 mL saturated sodium chloride solution added, followed by 2 mL hexane with a transfer pipette. The tubes were recapped and shaken vigorously by hand for 30 seconds. The layers were allowed to separate and the top layers transferred to autosampler vials with transfer pipettes. The standards were then analyzed by GC-FID. (Removal of methylene chloride from the standard mixture was a precautionary step. From previous experience with mixtures containing hexane, water, methanol, and methylene chloride, three layers will sometimes result-a top hexane layer; a middle methanol/water layer; and a bottom methylene chloride layer. Removal of solvent will make the amounts of the light ends, like methyl butyrate, inaccurate).
(The standards were capped and refrigerated (4 ℃) when not in use. After injection, the vials were recapped. Before use, the standards were allowed to come to room temperature and then rehomogenized).
A five-point calibration curve was prepared by plotting peak area ratios vs. amount ratios and performing a linear regression, forcing the origin, for each of the analytes:
Where µganalyte is the mass of the analyte, Areaanalyte is the peak area of the analyte, AreaISTD is the peak area of the internal standard , µgISTD is the mass of the internal standard, and m is the slope of the line.
Preparation of fish oil standard solution: NIST SRM3275-2 standardized fish oil, 0.1 g, was weighed into a vial. (The weight was recorded to four decimal places.) This yielded a nominal concentration of 1 mg/mL. The fish oil was quantitatively transferred to a 100-mL volumetric flask with hexane. The solution was diluted to volume with hexane, stoppered, and homogenized. Then, 100 µL of this solution was pipetted into a tube, followed by 60 µL of the internal standard solution. The tube was placed into a 100 ℃ heating block for a few minutes until all the solvent was removed. Concentrated hydrochloric acid, 100 µL, was added and the open tube placed in the heat block for 10 minutes. The tubes were then set aside for a few minutes to allow the tube to cool, after which 2 mL of boron trifluoride-methanol was added with a transfer pipette. The tube was capped tightly and heated at 100 ℃ for 10 minutes, with occasional shaking. Afterwards, the tube was allowed to cool to room temperature. Then, the cap was removed, 2 mL saturated sodium chloride solution added, followed by 2 mL hexane, with transfer pipettes. The tube was recapped and shaken vigorously by hand for 30 seconds. The tube was then centrifuged for 10 minutes at 4 ℃ and 3000 × g. Afterwards, with a transfer pipette, the top layer was transferred to an autosampler vial and capped.
(This solution was capped and refrigerated (4 ℃) when not in use. Before use, the solution was allowed to come to room temperature and then rehomogenized).
Sample preparation: University of Pittsburgh Institutional Review Board (PRO 08100243) provided ethical review and approval for the analysis of human samples in this study.
To a culture tube, 7 mL PBS was added with a 10-mL glass serological pipette, then 300 µL of blood was added with a pipette. The tube was capped and shaken vigorously for a few seconds and then centrifuged at 3000 × g for 10 minutes at 4 ℃. With a transfer pipette, all the supernatant was removed, leaving only the pellet at the bottom.
Another aliquot of 7 mL PBS solution was added to the tube, which was recapped, and the pellet resuspended by vigorously shaking the tube for a few seconds. The tube was then centrifuged again under the same conditions and the supernatant removed as before. Then, 60 µL of the ISTD solution was added, followed by 100 µL hydrochloric acid. The open tubes were heated at 100 ℃ for 10 minutes. The tube was removed from the heat block and allowed to cool to room temperature. With a transfer pipette, 2 mL boron trifluoride-methanol was added. The tube was capped tightly and heated at 100 ℃ for 10 minutes with occasional shaking. Afterwards, the tube was removed from the heat and allowed to cool to room temperature. The tube was uncapped and 2 mL saturated sodium chloride solution added, followed by 2 mL hexane, with transfer pipettes. The tube was recapped, shaken vigorously for 30 seconds, and centrifuged at 3000 × g for 10 minutes at 4 ℃. With a transfer pipette, the top layer was transferred to an autosampler vial and capped.
Precision and accuracy: To determine precision, a composite blood sample was prepared and analyzed by this method over twenty times. For both precision and accuracy, the fish oil standard solution was analyzed over twenty times.
Expressing final results: The final results should be reported as the ratio of the sum of the ω-3 fatty acid amounts, in µg, to the sum of the ω-6 fatty acid amounts, in µg.
The Fish Oil Standard should yield a result of 0.044 within a range of 0.040 to 0.049, according to the NIST Certificate of Analysis.
Results and Discussion
Chromatography was excellent for the calibration standards as well as for the NIST fish oil standard solution and the RBC composite sample (Figure 1a, Figure 1b, and Figure 1c).
Precision: Precision was excellent for the NIST fish oil standard and the composite whole blood sample, with CVs of 2 and 3%, respectively, for the ω-6/ω-3 ratios (Table 1 and Table 2).
Accuracy: Accuracy of the method was determined by comparison to the NIST fish oil standard. For the ω-6/ω-3 ratio, this method yielded 107% of what was listed by NIST in its Certificate of Analysis. The NIST data included that which was acquired by both GC-FID and GC-MS using response factors for quantitation [22].
Limitations: The test of accuracy uses fish oil which has a simple glycerol backbone, rather than a phospholipid, which may not perfectly reflect represent the phospholipids in plasma membranes.
There is a positive error in the amount determined for ALA; however, we are concerned with the accuracy of the ratio. NIST values for the fish oil are a combination of both GC-FID and GC-MS data, and perhaps this explains the reason for the differing values of this compound.
Other methods (e.g., Block [4]) lyse the blood cells with water prior to treatment with boron trifluoride/methanol.
The addition of hydrochloric acid digests the red blood cells by hydrolysis, freeing up the lipids, and prevents an emulsion from forming during the shaking step of the extraction procedure.
Conclusions
This method is simple and robust and gives both precise and accurate results for determining ω-6/ω-3 ratios in human red blood cells; sample preparation is done in one tube; and GC-FID runs were just over 30 minutes. The ω-6/ω-3 ratio allows objective dietary information to be obtained for the previous 30 days without reliance on dietary recall questionnaires or food diaries. It also avoids expensive duplicate diet studies, where portions of everything consumed are subjected to comprehensive laboratory analysis for analytes like fats, carbohydrates, vitamins, minerals, and proteins.
The method is limited to whole blood which has been stored in EDTA tubes, and it works on frozen blood samples which can sometimes be difficult to process. Additionally, it is not a complete fatty acid composition and assumes that other fatty acids may not be relevant.
Other types of samples could possibly be analyzed, such as food samples. Food-grade oils can be analyzed, as evidenced by the analysis of fish oil shown in this paper; however, analysis of other food products, such as meat, fish, nuts, or raw vegetables, is most likely not possible without a more vigorous digestion, possibly with more acid than in the method described in this paper, or even base; for example, various plant and animal tissues can be digested with alcoholic (typically methanol or ethanol) sodium or potassium hydroxide. This approach would have the advantage of simultaneous digestion and derivatization of fats to their esterified form-i.e., methyl esters if using methanolic NaOH or KOH. Like boron trifluoride, this process will derivatize glycerides, through transesterification, and methylate free fatty acids, though the latter reaction is an equilibrium reaction, so care must be taken to add a large excess of the derivatizing reagent.
Acknowledgements
This work was funded by the National Institutes of Health (NIH), Grant #R01CA204403, United States of America.
Conflicts of Interest
The authors assert that they have no conflicts of interest relevant to this work.