Determination of Favipiravir in Human Plasma by Using Liquid Chromatography-Tandem Mass Spectrometry: Application to Pharmacokinetic Studies
International Journal of Analytical and Bioanalytical Methods
(ISSN: 2633-8912)
Volume 3, Issue 1
Research Article
DOI: 10.35840/2633-8912/2416

Article Formats
Determination of Favipiravir in Human Plasma by Using Liquid Chromatography-Tandem Mass Spectrometry: Application to Pharmacokinetic Studies
Table of Content
Figures
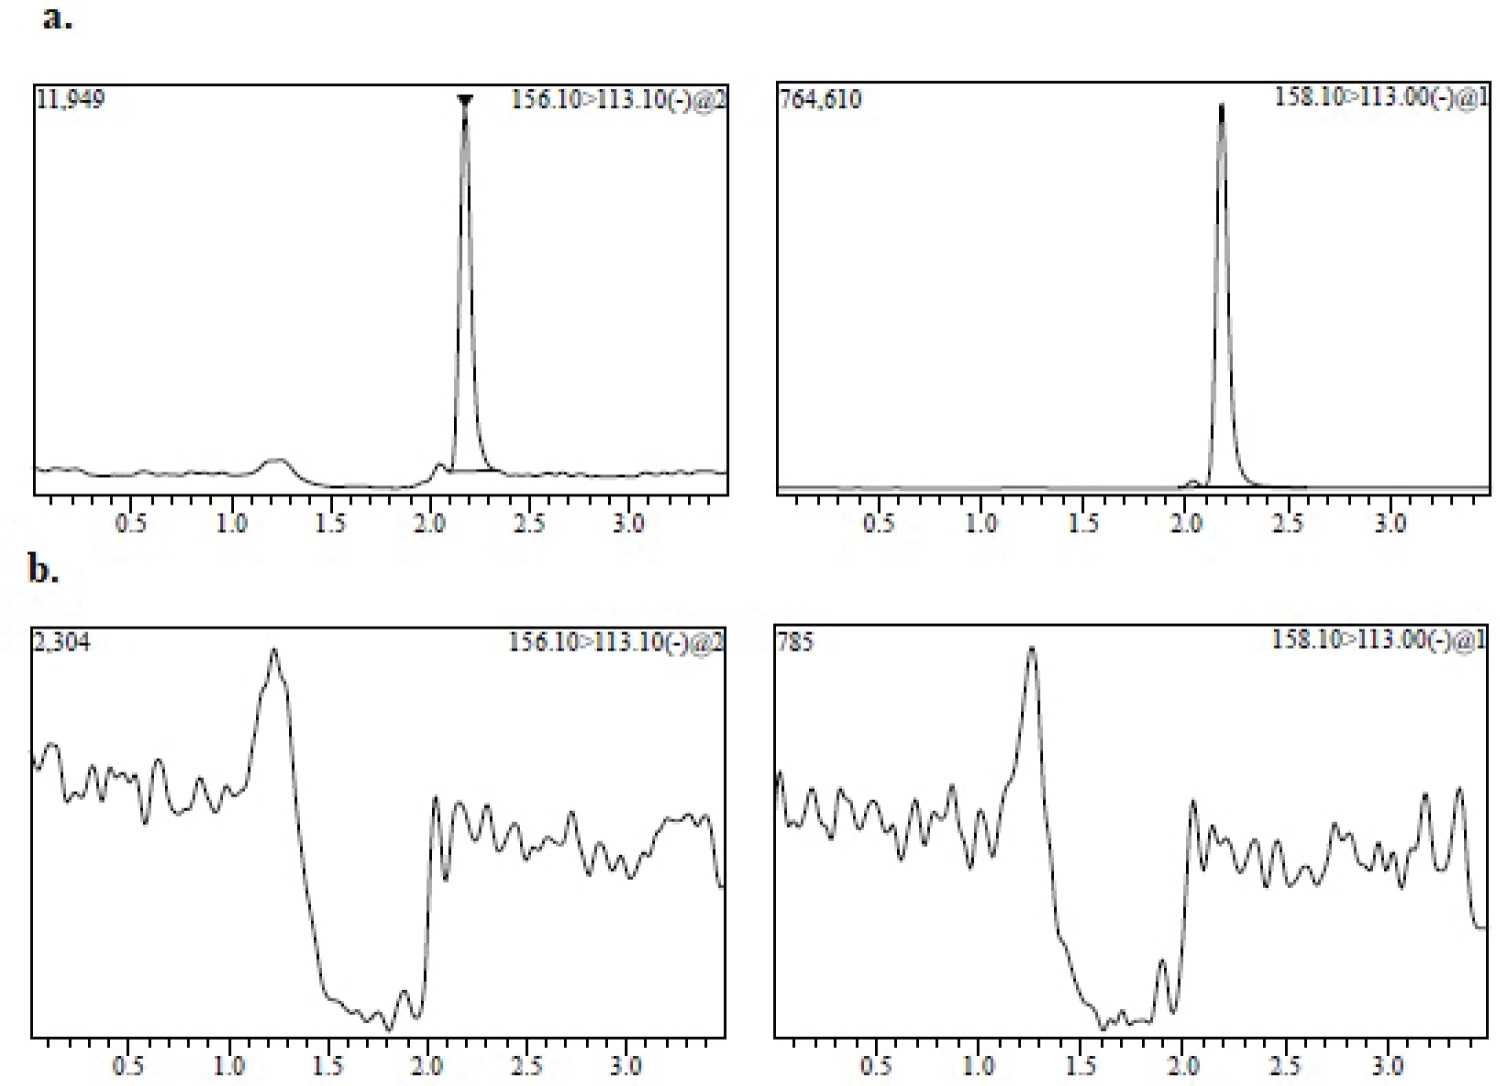
Figure 1: MRM chromatogram of 80 ng/mL (LLOQ) of favipiravir...
MRM chromatogram of 80 ng/mL (LLOQ) of favipiravir spiked with: a) Internal standard; b) Blank human plasma.
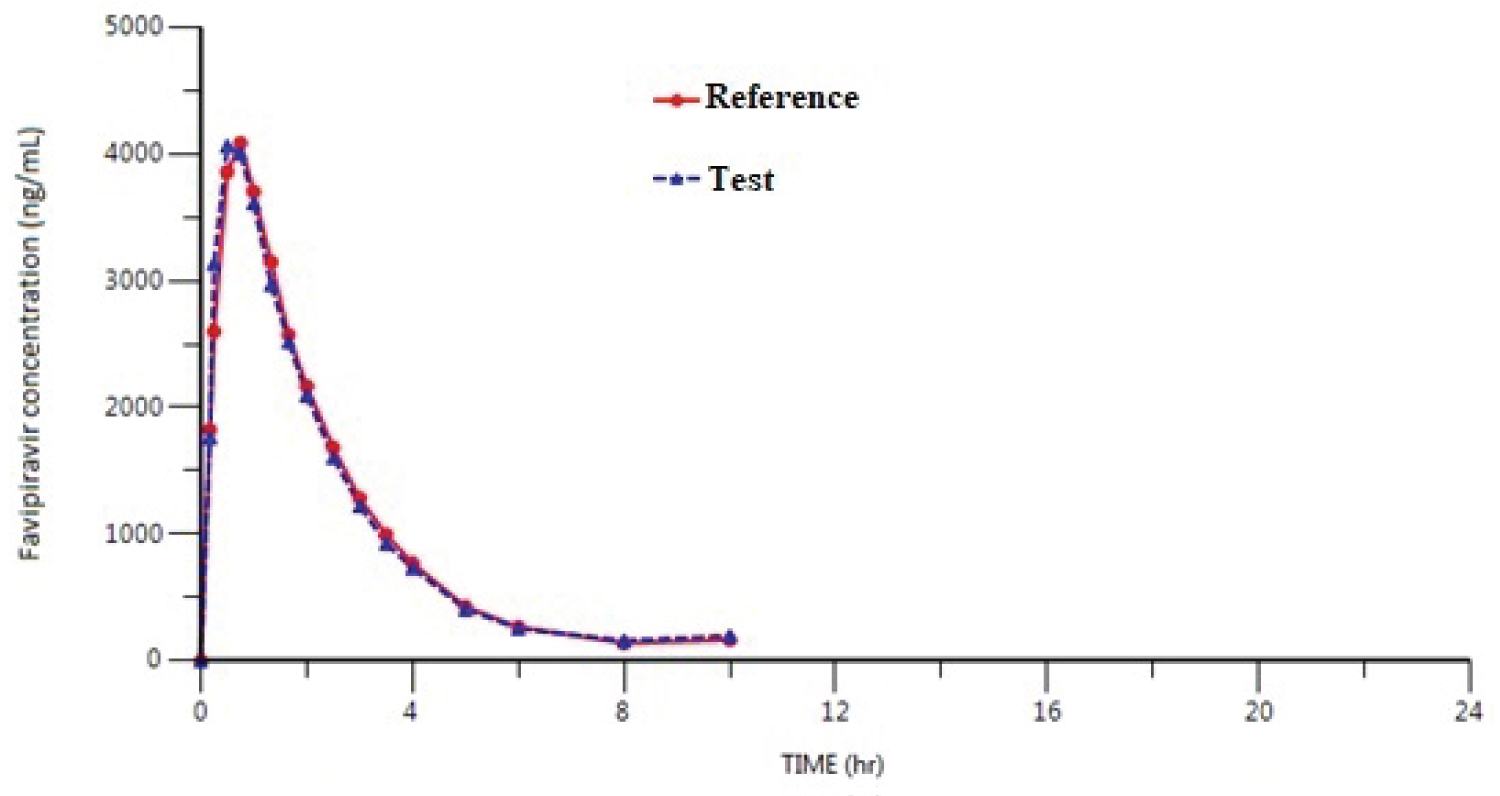
Figure 2: Mean plasma concentration-time curve after....
Mean plasma concentration-time curve after a single dose of a test drug and a reference drug (200 mg film tablet) of oral Favipiravir in healthy adult male subjects (n = 29) under fasting conditions.
Tables
Table 1: MS parameters for FAV and [13C15N] Favipiravir (IS).
Table 2: Results parameters of the calibration curve for linearity.
Table 3a: Within-batch precision and accuracy of the method for determining FAV in plasma samples.
Table 3b: Between-batch precision and accuracy of the method for determining FAV in plasma samples.
Table 4a: Results of Haemolysis Effect.
Table 4b: Results of Hyperlipidaemic Effect.
Table 5: Results of stability of FAV in human plasma under different storage conditions.
References
- Furata Y, Komeno T, Nakamura T (2017) Favipiravir (T-705), a broad spectrum inhibitor of viral RNA polymerase. Proc Jpn Acad Ser B Phys Biol Sci 93: 449-463.
- Tanaka T, Kamiyama T, Daikoku T, Takahashi K, Nomura N, et al. (2017) T-705 (Favipiravir) suppresses tumour necrosis factor alpha production in response to influenza virus infection: A beneficial feature of T-705 as an anti-influenza drug. Acta Virol 61: 48-55.
- World Health Organization (2015) Categorization and prioritization of drugs for consideration for testing or use in patients infected with Ebola. In: Ebola treatments and interventions.
- Madelain V, Nguyen THT, Olivo A, de Lamballerie X, Guedj J, et al. (2016) Ebola virus infection: Review of the pharmacokinetic and pharmacodynamic properties of drugs considered for testing in human efficacy trials. Clin Pharmacokinet 55: 907-923.
- Mentre F, Taburet AM, Guedj J, Anglaret X, Keita S, et al. (2015) Dose regimen of favipiravir for Ebola virus disease. Lancet Infect Dis 15: 150-151.
- Sissoko D, Laouenan C, Folkesson E, M'Lebing AB, Beavogui AH, et al. (2016) Experimental treatment with favipiravir for Ebola virus disease (the JIKI Trial): A historically controlled, single-arm proof-of-concept trial in Guinea. PLoS Med 13: e1001967.
- Japanese Pharmaceuticals and Medical Devices Agency (PMDA) (2014) Report on the deliberation results.
- Cai Q, Yang M, Liu D, Chen J, Shu D, et al. (2020) Experimental treatment with favipiravir for COVID- 19: An open-label control study. Engineering 6: 1192-1198.
- Chen C, Huang J, Cheng Z, Wu J, Chen S, et al. (2020) Favipiravir versus Arbidol for COVID-19: A randomized clinical trial. MedRxiv 2020.
- Haber K, Brügel M, Teupser D, Liebchen U, Scharf C, et al. (2021) Simultaneous quantification of seven repurposed COVID-19 drugs remdesivir (plus metabolite GS-441524), chloroquine, hydroxychloroquine, lopinavir, ritonavir, favipiravir and azithromycin by a two-dimensional isotope dilution LC-MS/MS method in human serum. J Pharm Biomed Anal 196: 113935.
- S. Department of Health and Human services, Food and Drug Administration, Center for Drug evaluation and research (CDER), Center for Veterinary Medicine (CVM) (2018) Bioanalytical method validation: Guidance for industry. Biopharmaceutics.
- Committee for Medicinal Products for Human Use (CHMP) (2011) Guideline on bioanalytical method validation. European Medicines Agency, EMEA/CHMP/EWP/192217/2009, Rev.1 Corr.2, London.
- Pharmaceuticals and Medical Devices Agency (PMDA) (2014) Report on the deliberation results of Avigan tablet 200 mg (Favipiravir).
Author Details
Nihal Saraner*, Berrak Guney, Gamze Sevici and Onursal Saglam
Novagenix Bioanalytical R&D Centre, Turkey
Corresponding author
Nihal Saraner, Novagenix Bioanalytical R&D Centre, 06970, Akyurt, Ankara, Turkey, Tel: +90-312-398-10-81, Fax: +90-312-398-07-18
Accepted: September 06, 2021 | Published Online: September 08, 2021
Citation: Saraner N, Guney B, Sevici G, Saglam O (2021) Determination of Favipiravir in Human Plasma by Using Liquid Chromatography-Tandem Mass Spectrometry: Application to Pharmacokinetic Studies. Int J Analyt Bioanalyt Methods 3:016.
Copyright: © 2021 Saraner N, et al. This is an open-access article distributed under the terms of the Creative Commons Attribution License, which permits unrestricted use, distribution, and reproduction in any medium, provided the original author and source are credited.
Abstract
The outbreak of Covid-19 infection has become a pandemic affecting millions of people throughout the world. No specific antiviral drugs have been approved for the treatment of Covid-19. The antiretroviral drug favipiravir (FAV) has been experimentally used for COVID-19 treatment since March 2020 in Japan. China’s Science and Technology Ministry official announced that Japan-based anti-flu drug FAV has been observed to help Covid-19 patients recover. Because of that, a simple LC-MS/MS method for the quantification of FAV in human plasma was developed and validated. Sample preparation was carried out using protein precipitation. The FAV and internal standard ([13C15N] Favipiravir, (IS)) were chromatographed under a liquid chromatography tandem mass spectrometry (LC-MS/MS) system on a Shiseido Capcell PAK C18, (250 × 4.6 mm, 5 μm) with mobile phase consisting of water and acetonitrile (15/85, v/v). FAV was analyzed by LC-MS/MS with electrospray ionization in the negative ion mode and the multiple reaction monitoring (MRM) mode. MRM transitions were m/z 156.1 ˃ 113.1 for FAV and m/z 158.1 ˃ 113 for IS. The lower limit of quantitation (LLOQ) for this method is 80 ng/mL. The linear calibration range is 80-30000 ng/mL for FAV. The results of the intra- and inter-day precision and accuracy studies were well within the acceptable limits. The method is precise and sensitive enough for its intended purpose. This validated method was applied to pharmacokinetic studies of favipiravir.
Keywords
Favipiravir, Covid-19, Human plasma, LC-MS/MS, Coronavirus
Introduction
The novel human coronavirus disease, Covid-19 which was first reported in Wuhan, China, in December 2019 has spread around the world affecting millions of people. Favipiravir (6-fluoro-3-hydroxypyrazine-2-carboxamine) which has shown broad-spectrum antiviral activity against several RNA viruses is an anti-influenza drug approved in Japan [1-7]. An official from the Science and Technology Ministry in China, stated that Favipiravir (FAV) was clearly effective in the treatment of Covid-19 and has been experimentally used for Covid-19 treatment. FAV showed superior efficacy in terms of the rate of clinical recovery and a reduced the incidence of fever and cough [8,9].
The aim of the study was to develop and validate a simple, cost effective and sensitive LC-MS/MS method for the determination of FAV in human plasma to be utilized in bioequivalence studies. Different quantitative methods have been described in the literature for analysis of favipiravir in human serum [10]. In literature, there are no methods for the determination of FAV using LC-MS/MS with protein precipitation in human plasma technique applicable to pharmacokinetic studies.
Experimental
Chemicals and materials
FAV was supplied from Kohn & Shawn Pharmatech Co., Ltd. (China), [13C15N] Favipiravir (IS) was supplied from AlsaChim (France). HPLC grade methanol and acetonitrile were purchased from Merck (Germany). K2EDTA drug free (blank) human plasma was obtained from Bioivt Laboratories International Ltd. (UK). High purity water was prepared in-house using a Milli-Q water purification system obtained from Millipore (USA).
Stock solutions, calibration standards and QCs
The stock solutions of FAV (5 mg/mL) and [13C15N] Favipiravir (IS) (0.2 mg/mL, IS) were prepared in methanol. Working solutions of FAV were prepared by diluting the stock solutions with methanol. The internal standard working solution including [13C15N] Favipiravir (IS) was prepared in methanol at a concentration of 10 μg/mL. All the stock and working solutions were stored at -20 °C.
Calibration standards and quality control samples were prepared from separately weighed stocks. Calibration standards and quality control samples were prepared by spiking the appropriate amounts of working solutions in the blank matrix to obtain final concentration levels. Final concentrations were 80, 160, 1000, 5000, 10000, 20000, 27000, 30000 ng/mL for calibration standards. Quality control samples were prepared in the same way and the final concentrations were 80(LLOQ), 240(QC Low), 1500(QC Medium1), 12000(QC Medium2) and 24000(QC High) ng/mL. QC samples were stored at -70 °C freezer until needed.
Instrumentation
The determination of FAV was carried out using an LC-MS/MS system (Shimadzu, Japan) consisting of LC-20AD XR pumps, SIL-20ACXR auto sampler, CTO-10 AS VP column oven and Shimadzu 8040 Mass Spectrometer. Lab Solutions Version 5.93 was used for data acquisition and evaluation of chromatographic data. HPLC separation was performed on Shiseido Capcell PAK C18, 250 × 4.6 mm, 5 μm with mobile phase consisting of water and acetonitrile (15:85, v/v) with column oven temperature maintained at 30 °C. Flow rate was 1.2 mL/min and total run time was 3.5 min.
The mass spectrometer was operated in the negative ESI mode with 5500 V ESI voltage, 2.5 L/min nebulizing gas flow and 15 L/min drying gas flow rate. Quantification was performed with the multiple reaction monitoring mode (MRM) by monitoring the following ion transitions: 156.1→113.1 and 158.1→113 for FAV and [13C15N] Favipiravir, respectively. Detailed information for MS parameters is represented in Table 1.
Sample preparation
Before analysis, the plasma sample was thawed to room temperature. After spiking 50 μL of IS working solution with 100 μL plasma sample, 500 μL of acetonitrile was added for protein precipitation. After vortexing for 30 s, the samples were centrifuged at 5500 rpm for 10 min. 5 μL of the supernatant injected directly into the LC-MS/MS system for analysis.
Method validation
Method validation was performed to evaluate the sensitivity, selectivity, linearity, precision, accuracy, hemolysis and hyperlipidemia effects, carry-over, matrix effect, maximum batch size, recovery, dilution integrity and various stability tests according to the US Food and Drug Administration (2018) and European Medicines Agency (2011) guidelines [11,12].
Selectivity: Eight different sources of human plasma (including hemolyzed and hyperlipidemic plasma) were screened for interference at the retention time of the analyte and the IS. The selectivity evaluation showed that the presence of interfering peak at the same retention time of FAV were less than 20% of the LLOQ response, when analyzing blank plasma, one hemolyzed and one hyperlipidemic plasma. The selectivity of the method was demonstrated with the chromatograms of blank plasma and LLOQ samples (Figure 1). At the high QC concentration (QC4), an extracted sample of FAV was prepared without adding IS (triplicate) to observe any interference at the retention time of the IS. Also, the response for interfering peaks at the retention time of IS was also less than 5%, considering the response in the concentration used. An extracted solution of the IS equivalent to the IS concentration was prepared without FAV in triplicate to observe any interference at the retention time of FAV. There was no interference.
The possible interference from concomitant drugs (paracetamol and ibuprofen) was evaluated by spiking blank with very high concentration of 10 μg/mL for paracetamol and ibuprofen. And no interference was observed.
Linearity: The linearity of the method was proven for FAV in the concentration range of 80-30000 ng/mL including the LLOQ. A linear equation was established to obtain the best fit for the concentration vs. response using 1/X2 as weighting factor for FAV. Eight freshly prepared calibration standards for FAV (80, 160, 1000, 5000, 10000, 20000, 27000, 30000 ng/mL) were assayed in each of three validation batches. The average determination coefficients (r2) for analyte was 0.9977 or higher. Calibration curves consisted of eight non-zero samples, a blank sample and a blank spiked IS (zero) sample, covering the quantitation range. 75% of the eight calibration standards, when back-calculated concentrations should be within ± 15% of the nominal value, except for LLOQ, which should be within ± 20% of the nominal value. LLOQ and ULOQ must fulfil the acceptance criteria of a calibration curve [11,12]. The calibration curve parameters and the back-calculated concentrations of the calibration standards are presented in Table 2.
Accuracy and precision: The intra- and inter-day precisions accuracies of the assay were measured for FAV at each QC level with six replicates, including the LLOQ. Three precision and accuracy batches were analyzed on different days. The intra-day and inter-day accuracy and precision results are presented in Table 3a and Table 3b. The concentrations of FAV in quality control samples were calculated by interpolation from the line of best fit for calibration standards. The regression algorithm was 1/X2 weighting linear regression based on analyte to internal standard peak-area ratios using the Shimadzu LabSolutions version 5.93 Software program.
Matrix effect: Matrix effect was assayed at two concentration (QC Low and QC High) levels for FAV. Matrix effects were investigated using six different lots of blank matrix (including one haemolysed and one lipemic plasma). The matrix effect factor was calculated for each lot of matrix, by calculating the ratio of the peak area in the presence of matrix (blank matrix spiked with FAV and IS after extraction) to the peak area in absence of matrix (pure solutions of FAV and IS). The IS normalized matrix effect factor (MF) was also calculated by dividing the MF of the FAV by the MF of the IS. These determinations were done in six replicates for two different concentrations. The precision (%CV) of QC Low and QC High were 9.317% and 2.417% for FAV. From the results, it is apparent that there was no matrix effect on FAV.
Recovery: Recovery was determined by comparing mean area response of extracted samples (spiked before extraction) to that of unextracted samples (spiked after extraction) at each QC level. Multiple aliquots (n = 6) at each of the three QC concentration (QC low, QC Medium2, QC High) were assayed and mean recovery for FAV was found to be 91.371%.
Carry-over: Carry-over was assessed in validation batches by injecting a blank sample after calibration standard at the upper limit of quantification (ULOQ) and a high concentration sample (QC4). It appeared that there was no carry-over.
Influence of haemolysed-hyperlipidaemic plasma: For investigation of influence of haemolysed and lipemic plasma, QC samples were prepared with normal plasma and with haemolysed plasma and with lipemic plasma for two different concentrations (QC low and QC High), separately. Six replicates of QC low and QC high level samples were assayed. Results demonstrate that there was no influence of haemolysed and hyperlipidaemic plasma on the analysis of FAV (Table 4a and Table 4b).
Dilution integrity: Dilution integrity was validated by preparing 1.7 times of the upper limit of quantification (ULOQ). And then that dilution sample was diluted with blank plasma at 1/2 and 1/20 ratios and analyzed with freshly spiked calibration standards. The results were compared to the concentration after correcting for dilution. For the FAV the bias of mean value of diluted samples was within ± 15.0% of nominal value (0.244% for 1/2 dilution and 4.847% for 1/20 dilution sample) and CV at each level was within ± 15.0% (1.446% for 1/2 dilution and 2.314% for 1/20 dilution sample). Thus, when the calculated concentration of the samples is above ULOQ, the samples can be diluted 1/2 or 1/20 times, if necessary, to fit within the calibration curve.
Batch size: The maximum batch size was tested by demonstrating accuracy and precision of QC samples over a run in a size equivalent to the expected analytical run. For that, two validation batches were extracted and analyzed. Blank samples were injected between two validation batches to mimic the actual size of a study run. The QC samples were compared to the calibration curve of the first validation batch. Overall number of injections of all calibration curve samples, QC samples and blank samples was 97.
Stability: The QC samples at QC low and high level (n = 6, each) were stored and frozen for 24 hours in the -70 °C freezer and thereafter thawed unassisted at room temperature. When completely thawed, the samples were frozen again at the same temperature for at least 12 hours. The freeze-thaw cycle was repeated 3 more times. After completion of 4th freeze thaw, the stability samples were processed with freshly prepared calibration standards and freshly prepared QC low and high samples and analysed in a single run. The results of freeze-thaw stability test indicated that FAV is stable in human plasma for 4 cycles when stored at -70 °C and thawed to room temperature.
The bench top stability was tested by keeping QC samples in plasma at QC low and high level (n = 6, each) at room temperature for 5 hours for FAV. For that, the QC samples were kept on the bench at room temperature before extraction and kept at this temperature for 5 hours. After 5 hours, the stability samples were processed with freshly prepared calibration standards and analysed in a single run. The results of bench top stability test indicated that FAV is stable in plasma at room temperature for 5 hours.
A batch consisting of calibration standards and two sets of QC low and high samples were extracted and one set of QC low and high samples were analysed with calibration standards. Processed sample stability was assessed by injecting one set of QC low and high samples and reinjecting the other set QC low and high samples together with freshly spiked calibration standards, after being left in the autosampler for a longer period of time than that required to process a run of study samples. FAV is stable in extracts at autosampler conditions (10 °C) for 24 hours.
The QC samples at QC low and high level (n = 6, each) were allowed to stand for 60 days at -70 °C temperature freezer. The stability samples were processed with freshly prepared calibration standards and analysed in a single run for long term plasma stability in validation. The results of long term stability test indicated that FAV is stable in plasma at -70 °C temperature freezer for 60 days. The stability results were summarized in Table 5.
Results and Discussion
Results
Application of the method: The proposed validated method was applied to bioequilavence studies of FAV in 29 healthy subjects under fasting conditions. Plasma samples were periodically collected up to 12 hours after administration of FAV at a single oral dose of 200 mg test drug (T) and reference drug (R) to male volunteers. A randomised, single oral dose, cross-over, two-period study was carried out. The study is approved by a local ethics committee, written informed consents were obtained from all participants. Samples were collected before dosing and 0.17, 0.25, 0.50, 0.75, 1.00, 1.33, 1.66, 2.00, 2.50, 3.00, 4.00, 6.00, 8.00, 12.00 hours following drug administration. They were collected into polypropylene tubes using K2EDTA as anti-coagulating agent. The blood samples were centrifuged at 3000 rpm for 10 min at 4-6 °C, plasma samples was seperated and store at -70 °C until analysis. The plasma samples obtained at various time intervals were determinated by validated FAV method. The mean pharmacokinetic profiles for the studies are presented in Figure 2. For the Test and Reference products, the mean maximum plasma concentration(Cmax) were found as 5002.171 ± 1231.177 ng/mL and 5411.624 ± 2025.680 ng/mL, respectively. Mean time to achieve maximum plasma concentration (Tmax) was 0.50 (0.17-1.66) h for test and 0.75 (0.17-2.5) h for reference. The mean value of area under the curve from t0 to tlast (AUC0-t) was 9641.989 ± 2545.142 ng.h/mL for T and 9907.170 ± 2423.528 ng.h/mL for R. Area under the curve from t0 to infinity for T and R were 9910.494 ± 2618.916 ng.h/mL and 10152.115 ± 2507.694 ng.h/mL respectively. The elimination half-life time (t1/2) was 1.266 ± 0.251 h for T and 1.319 ± 0.245 for R. The ratio of T/R and 90% confidence intervals (CI) for overall analysis were comprised within the range (80-125%). The target variables data demonstrate the bioequivalence of test and reference products with regard to CI for Cmax of 92.92-119.89 and for AUC0-tlast of 94.00-99.77. The geometric mean ratios were found as 105.55% and 96.84% for Cmax and AUC0-tlast, respectively. The results demonstrated the bioequivalence of the two formulations of FAV. The descriptive statistics of the pharmacokinetic parameters of the study were comparable to those reported in Report on the Deliberation Results of Avigan Tablet 200 mg (Favipiravir), Pharmaceuticals and Medical Devices Agency (PMDA), 04.03.2014 [13].
An incurred sample reanalysis (ISR) was performed on randomly selected points from study samples. The difference between the initial concentration and the concentration measured during the repeat analysis should be within 20% of the mean for at least 67% of the repeats according EMA (2011) guideline [12]. 112 samples were analyzed for ISR and 98.2% of the repeats of sampling points met the acceptance criteria.
Discussion
In this study, a sensitive and simple LC-MS/MS method was established to determine favipiravir in human plasma. Positive and negative ion modes were tested to optimize favipiravir response and negative ion mode was chosen for detection. Additionally, liquid-liquid extraction (LLE) with different organic solvents like ethyl acetate, hexane, dichloromethane, diethyl ether and methyl tert-butyl ether (MTBE) extraction techniques were tried. But as the purpose was to develop a sensitive, quick and cost-effective method, protein precipitation was tested. Protein precipitation technique carried out using ethanol, methanol and acetonitrile solvents. Precipitation with acetonitrile caused the lowest matrix effect with better peak shape compared to other organic solvents. The results with best recoveries and lowest matrix effect for the analytes were achieved with the solvent of acetonitrile. For mobile phase, methanol and acetonitrile were tried with different buffer solutions an acid additives like formic acid and acetic acid with using Shiseido Capcell PAK C18, 250 × 4.6 mm, 5 μm column. It was observed that water and acetonitrile (15:85, v/v) as the mobile phase was most appropriate to give best sensitivity, efficiency and peak shape.
Conclusion
An LC-MS/MS method using protein precipitation with an LLOQ of 80 ng/mL was developed for the determination of FAV in human plasma. The method was successfully validated for selectivity, sensitivity, linearity, accuracy, precision, matrix effect, recovery and stability. The results showed that the method proposed can be used for routine analysis of FAV in human plasma and effectively be utilized in pharmacokinetic studies and/or bioequivalence studies.