International Journal of Analytical and Bioanalytical Methods
(ISSN: 2633-8912)
Volume 1, Issue 1
Research Article
DOI: 10.35840/ijabm/2402

Article Formats
Determination of Dasatinib in Human Plasma by Using Liquid Chromatography-Tandem Mass Spectrometry
Table of Content
Figures
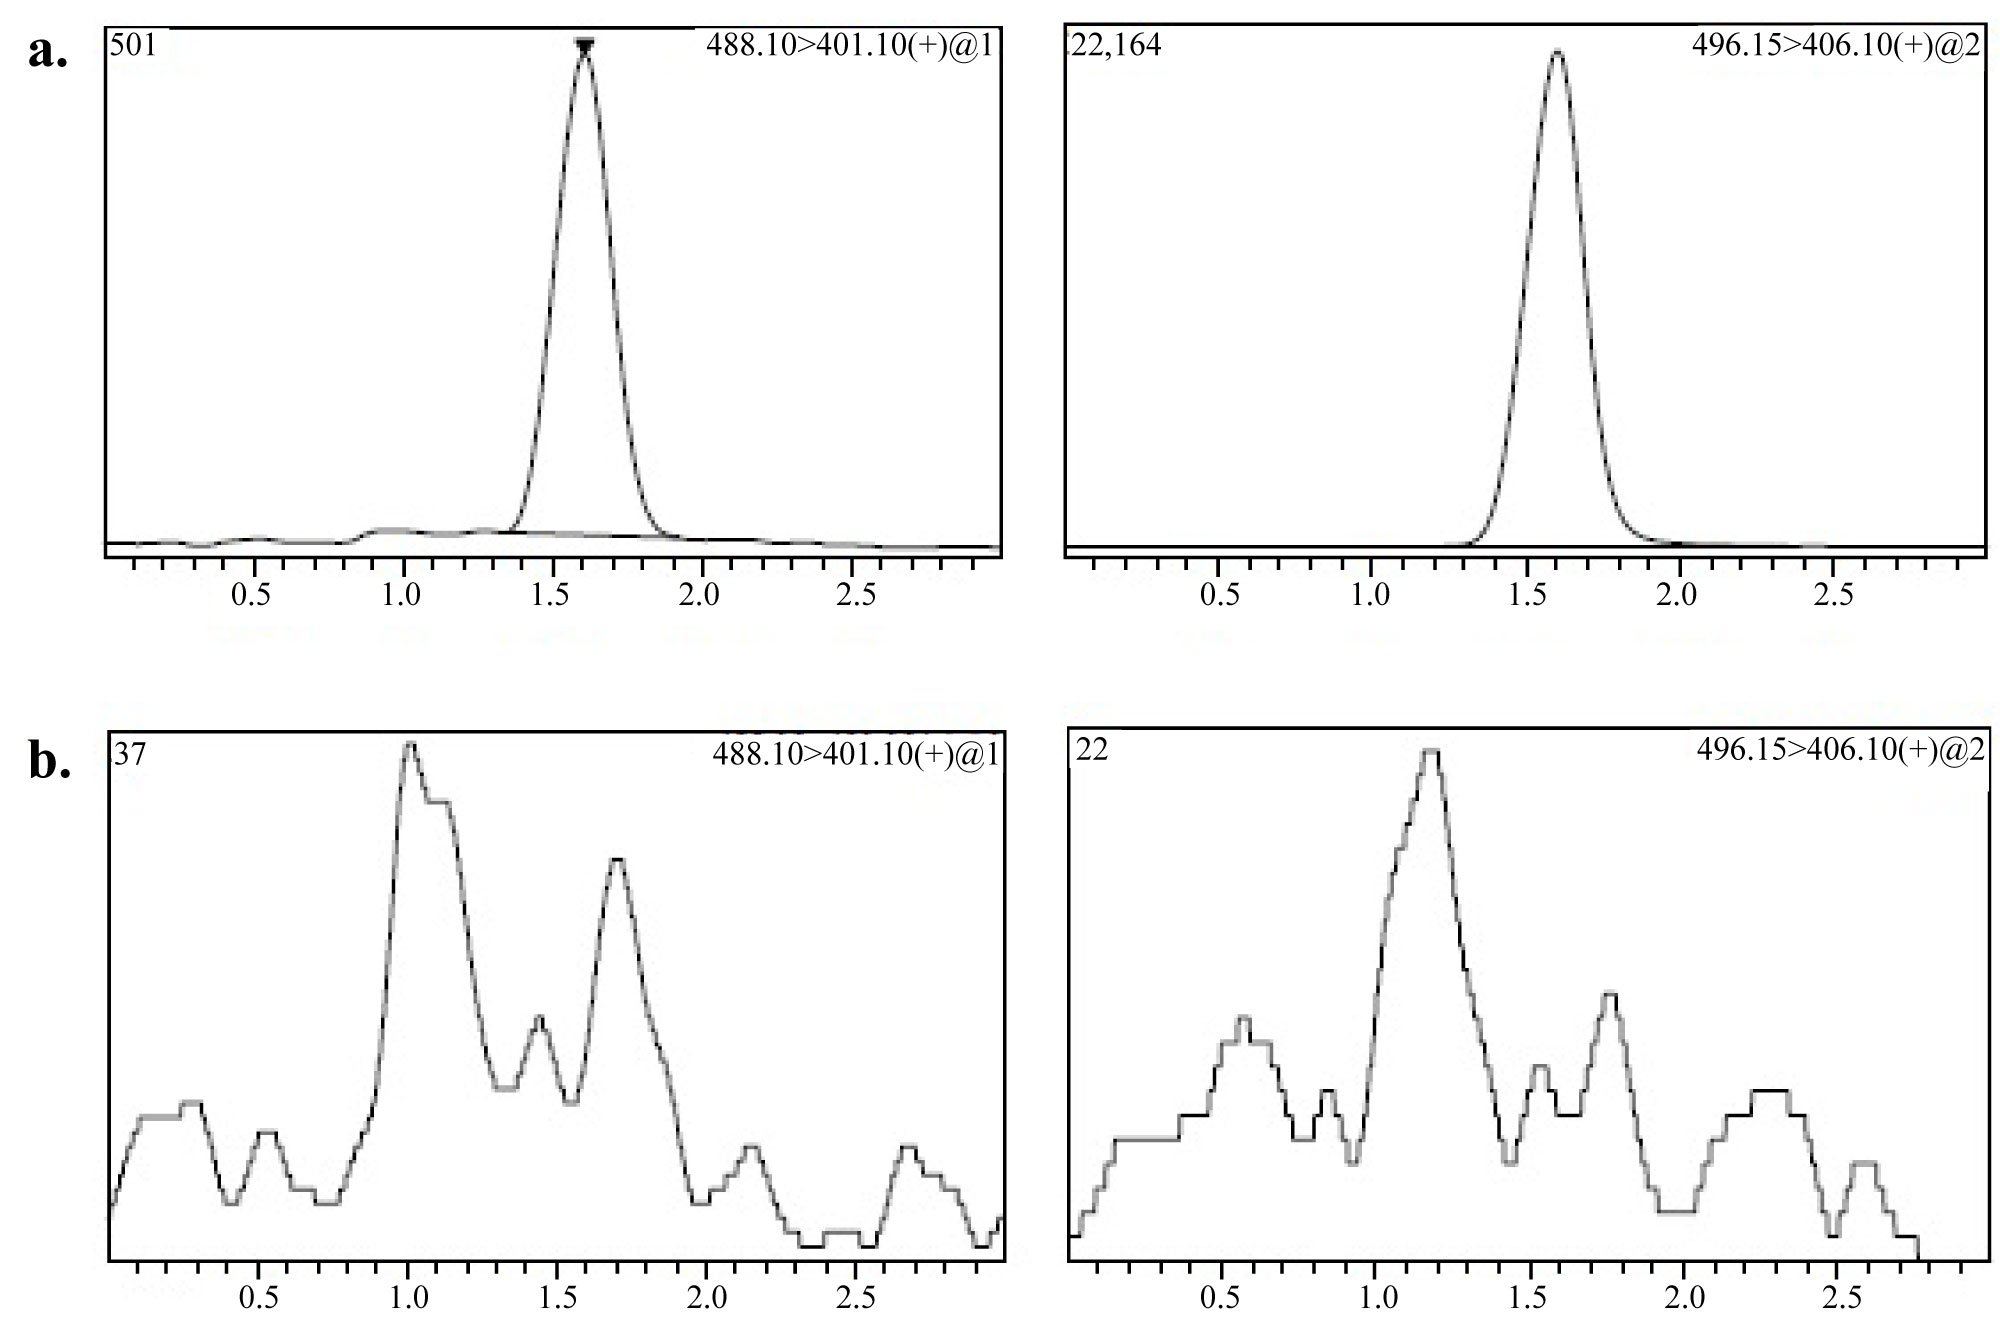
Figure 1: MRM chromatograms of 1 ng/mL...
MRM chromatograms of 1 ng/mL (LLOQ) of a) DAS Spiked with internal standard; b) Blank human plasma.
Tables
Table 1: MS parameters for DAS and DASD8.
Table 2A: Within-batch precision and accuracy of the method for determining DAS in plasma samples.
Table 2B: Between-batch precision and accuracy of the method for determining DAS in plasma samples.
Table 3: Results of matrix effects for dasatinib (n = 6).
Table 4: Results of stability of DAS in human plasma under different storage conditions.
Table 5: Results of long term stability of stock for dasatinib and dasatinib d8.
References
- Krause DS, Van Etten RA (2005) Tyrosine kinases as targets for cancer therapy. N Engl J Med 353: 172-187.
- Sreedevi A, Rao AL (2013) Development and validation of novel HPLC method for estimation of dasatinib in bulk and pharmaceutical dosage form. IJRPC 3: 724-729.
- Francia SD, D'Avolio A, Martino FD, Pirro E, Baietto L, et al. (2009) New HPLC-MS method for similtaneous quantification of the antileukemia drug imatinib, dasatinib and nilotinib in human plasma. J Chromatogr B 877: 1721-1726.
- Pirro E, Francia SD, Martino FD, Fava C, Ulisciani S, et al. (2011) A new HPLC-UV validated method for therapeutic drug monitoring of tyrosine kinase inhibitors in leukemic patients. J Chromatogr Sci 49: 753-757.
- Lankheet NA, Hillebrand MJ, Rosing H, Schellens JH, Beijnen JH, et al. (2013) Method development and validation fot the quantification of dasatinib, erlotinib, gefitinib, imatinib, lapatinib, nilotinib, sorafenib and sunitinib in human plasma by liquid chromatography coupled with tandem mass spectrometry. Biomed Chromatogr 27: 466-476.
- Andriamanana I, Gana I, Duretz B, Hulin A (2013) Simultaneous analysis of anticancer agents bortezomib, imatinib, nilotinib, dasatinib, erlotinib, lapatinib, sorafenib, sunitinib and vandetanib in human plasma using LC/MS/MS. J Chromatogr B 926: 83-91.
- Kralj E, Trontelj J, Pajic T, Kristl A (2012) Simultaneous measurement of imatinib, nilotinib and dasatinib in dried blood spot by ultra high performance liquid chromatography tandem mass spectrometry. J Chromatogr B 903: 150-156.
- D'Avolio A, Simiele M, Francia SD, Ariaudo A, Baietto L, et al. (2012) HLPC-MS method for the simultaneous quantification of antileukemia drugs imatinib, dasatinib and nilotinib in human peripheral blood mononuclear cell (PBMC). J Pharm Biomed Anal 59: 109-116.
- Haouala A, Zanolari B, Rochat B, Montemurro M, Zaman K, et al. (2009) Therapeutic drug monitoring of the new targeted anticancer agents imatinib, nilotinib, dasatinib, sunitinib, sorafenib and lapatinib by LC tandem mass spectrometry. J Chromatogr B 877: 1982-1996.
- Furlong MT, Agrawal S, Hawthorne D, Lago M, Unger S, et al. (2012) A validated LC-MS/MS assay for simultaneous determination of the anti-leukemic agent dasatinib and two pharmacologically active metabolites in human plasma: Application to a clinical pharmacokinetic study. J Pharm Biomed Anal 58: 130-135.
- (2011) Bioanalytical method validation, guidance for industry. U.S. Department of Health and Human services, Food and Drug Administration, Center for Drug evaluation and research (CDER), Center for Veterinary Medicine (CVM).
- (2011) Guideline on bioanalytical method validation. EMEA/CHMP/EWP/192217/2009 Rev.1 Corr.2, London.
Author Details
Nihal Saraner*, Aysen Karagoz, Berrak Guney and Onursal Saglam
Novagenix Bioanalytical R&D Centre, Turkey
Corresponding author
Nihal Saraner, Novagenix Bioanalytical R&D Centre, 06970, Akyurt, Ankara, Turkey, Tel: +90-312-398-10-81, Fax: +90-312-398-07-18.
Accepted: March 05, 2019 | Published Online: March 07, 2019
Citation: Saraner N, Karagoz A, Guney B, Saglam O (2019) Determination of Dasatinib in Human Plasma by Using Liquid Chromatography-Tandem Mass Spectrometry. Int J Analyt Bioanalyt Methods 1:002.
Copyright: © 2019 Saraner N, et al. This is an open-access article distributed under the terms of the Creative Commons Attribution License, which permits unrestricted use, distribution, and reproduction in any medium, provided the original author and source are credited.
Abstract
A liquid chromatography tandem mass spectrometry (LC-MS/MS) method was developed and validated to determine dasatinib (DAS) in human plasma. Protein precipitation procedure was used in sample preparation. The analyte and internal standard (dasatinib-d8 (DASD8) were separated on Waters Atlantis dC18 Column (75 × 4.6 mm, 3.5 µm). Multi reaction monitoring detection was performed by electrospray ionization in the positive ion mode. The MRM transitions of m/z 488.1 > 401.1 for DAS and 496.15 > 406.1 for DASD8 were used to quantify. The standard curve was found to be linear in the range of 1-400 ng/mL for dasatinib. The lower limit of quantification (LLOQ), using 200 µL human plasma, was 1 ng/mL. The developed and validated method could be applied to the bioequivalence study in human plasma samples.
Keywords
Dasatinib, Dasatinib-d8, Human plasma, LC-MS/MS
Introduction
Dasatinib is an anticancer tyrosine kinase inhibitor. Tyrosine kinase inhibitors are directed against tyrosine kinases, which play an essential role in the transduction of growth signals in cells [1]. Dasatinib is indicated for treatment of chronic myelogenous leukemia and philadelphia chromosome-positive acute lymphoblastic leukemia in chronic phase [2].
A number of methods have been developed for determination of DAS in human plasma individually or in combination with other drugs [3-10]. Common methods for the determination of dasatinib in human plasma are utilizing either protein precipitation (PP), solid phase extraction (SPE) or liquid-liquid extraction (LLE) for sample preparation [3-10]. However, the procedures employed in these studies have relatively longer run times which are disadvantage to be employed for batches with large number of sample [3-6,8,9]; complicated and expensive sample preparation steps [7,10].
Development of simpler, inexpensive sample-preparation techniques is an important issue in chemical analysis, so that; protein precipitation technique is chosen. The aim of this present study was to develop a simple, rapid, cheap and sensitive method for DAS determination using protein precipitation in plasma samples. This method could be applied to the samples obtained from clinical trials.
Experimental
Chemicals and materials
Dasatinib, Dasatinib D8 were obtained from Clearsynth (Mumbai, India), respectively. HPLC grade methanol, formic acid and ethanol were purchased from Merck (Darmstadt, Germany). K2EDTA drug free (blank) human plasma was obtained from Sera Laboratories International Ltd (UK). High purity water was prepared in-house using a Milli-Q water purification system obtained from Millipore (USA).
Stock solutions, calibration standards and QCs
Stock solutions were made by dissolving suitable amount of DAS in methanol. Further standard working solutions (0.02, 0.04, 0.2, 1, 2, 4, 7.2, 8 µg/mL for calibration standards and 0.02, 0.06, 0.8, 3.2, 6.4, 8 µg/mL for quality control samples) were obtained by serial dilution of the stock solutions with methanol. The working internal standard solution including DASD8 was prepared in methanol at concentration of 0.4 µg/mL (IS). Stock solutions of DAS and DASD8 were stored at -20 ℃. For preparation of calibration standards and quality control samples, appropriate aliquots of the stock solution DAS or working solutions were added to drug-free human plasma. The calibration curve ranged from 1 to 400 ng/mL for DAS. The quality control (QC) samples were prepared at four concentration levels of 1 (LLOQ, the lower limit of quantification), 3 (QC Low), 40 (QC Medium 1), 160 (QC Medium 2), 320 (QC High) ng/mL for DAS in a manner similar to preparation of calibration curve samples from stock solutions.
Instrumentation
The LC-MS/MS system (Shimadzu, Japan) consisting of LC-20AD XR solvents pumps, SIL-20ACXR autosampler, CTO-10 AS VP column oven, FCV-20AH2 valve unit and Shimadzu 8040 Tandem Mass Spectrometer. Waters Atlantis dC18 (75 × 4.6 mm, 3.5 µm) column was used for separation with methanol, water (60:40 v/v) containing 0.1% v/v formic acid solution as a mobile phase at the flow rate of 0.7 mL/min. The total run time for each analysis was 3 min. Shimadzu 8040 Tandem Mass Spectrometer was used equipped with electrospray ionization in the positive ion mode. The optimization of DAS and DASD8 in Shimadzu's LCMS systems was performed by using Shimadzu LabSolutions Software version 5.82 SP1 based on a rapid series of automated flow injection analyses. The multiple reaction monitoring (MRM) transitions were performed at m/z 488.1→401.10 and 496.15→406.1 for DAS and DASD8. The nebulizing gas and drying gas flow rates and the ESI voltage were 2.5 L/min, 15 L/min and 5500 V, respectively. The gas used for nebulizing and drying was high pure nitrogen generated by Peak Scientific NL-60. Detailed information for MS parameters is represented in Table 1.
Sample preparation
Sample preparation (200 µL human plasma) resulted in a clear colorless supernatant by a short centrifugation step (5500 rpm for 10 min) after protein precipitation using 50 µL methanolic IS (0.4 µg/mL) and methanolic formic acid solution (0.1% v/v) as a precipitation reagent. An aliquot of 20 µL of the supernatant was injected into the LC-MS/MS system for analysis.
Results and Discussion
Method validation
The method was validated according to both US-FDA Bioanalytical Method Validation Guidance [11] and European Medicines Agency Guideline on Bioanalytical Method Validation [12] with respect to selectivity and linearity, calibration curve, precision and accuracy, recovery, matrix effect and stabilities. Method validation was performed with K2EDTA human plasma.
Selectivity
Figure 1 shows the chromatograms (a) Blank plasma spiked with IS and analytes at LLOQ; and (b) Drug-free human plasma. The method selectivity was determined by analyzing eight different sources of human plasma to demonstrate the lack of chromatographic interference at the retention time of DAS and DASD8.
Linearity
The calibration curves were created by plotting the peak area ratios of the various analytes to internal standard versus nominal concentration of the analytes standards. Both calibration curves were regressed using a linear equation with weighting factor of 1/X2. Calibration curves were linear with coefficient of correlation (r2) values more than 0.9982. Range was 1-400 ng/mL for DAS including the LLOQ. Calibration curves were constructed from blank sample (processed matrix sample without analyte and without IS), a zero sample (processed matrix with IS) and eight non-zero samples. The standard concentration must be within 15% deviation from the nominal value except at LLOQ. The LLOQ was defined as the lowest concentration yielding a signal to noise ratio of least 10 with a coefficient of variation (precision, CV) < 20% and accuracy of 80-120%. At least 75% of eight non-zero samples must be met exception criteria including acceptable LLOQ and ULOQ [11,12].
Accuracy and precision
The intra- and inter-day precisions and accuracies of LLOQ, QC Low, QC Medium 1, QC Medium 2 and QC High were summarized in Table 2a and Table 2b. Six replicates of QC samples were analyzed at five concentration levels respectively to evaluate the intra-day precisions and accuracies. This process was repeated on three consecutive days in order to evaluate inter-day precisions and accuracies.
Matrix effect
Matrix effect was assayed at two concentration (QC Low and QC High) levels for DAS. Six different plasma lots (including one hemolytic and one lipemic plasma) free of any significant interference at the retention time (RT) of analytes and internal standards, were selected. Experiments were performed at low (QC2) and high (QC4) quality control levels in six replicates using the ratios of peak areas of the blank plasma samples spiked after extraction to those of pure standard solutions containing analyte at the same concentrations. The precision (%CV) of QC Low and QC High were 3.29% and 6.18% for DAS. The matrix effect results were summarized in Table 3.
Recovery
Recovery was determined by comparing the analytical results of extracted samples with those of extracts of control matrix spiked with analyte post extraction. Recovery was estimated at three concentration levels (3 ng/mL, 160 ng/mL and 320 ng/mL) by comparing the mean analytes responses of six extracted samples with those of appropriately diluted standard solutions. For three concentration levels; recovery was 113.08%, 105.66%, 108.37% respectively. So that for our validated method mean overall recovery for DAS was 109.04 ± 3.76%. The recovery of internal standard was measured in a similar manner using corresponding medium QC samples as reference. Mean recovery of internal standard was 97.66% for DASD8.
Stability
The bench top stability was examined by keeping replicates of spiked plasma with low and high quality control samples at room temperature for approximately 5 hours for DAS. Freeze-thaw stability of samples were obtained over 3 cycles, by thawing at room temperature for 1 hour and refrozen for 12-24 h. The processed samples were stable up to 47.5 hours in autosampler at 10 ℃. Long term plasma stability was evaluated at -70 ℃ over a period of 90 days. The stability results were summarized in Table 4. For DAS and DASD8 the stability of stock solutions at -20 ℃ was determined in triplicate. Analytes were considered to be stable in stock solutions if 90-100% of the initial concentration found. Long-term stock solution stability at -20 ℃ was established for stock solutions of DAS and DASD8 for 7 days (Table 5).
Conclusion
We developed and validated an LC-MS/MS method with ESI interface using positive ion mode for simultaneous determination of DAS in human plasma. Use of deuterated internal standards guaranteed the success of the assay by eliminating the impact of matrix effects. The developed method was validated to have sufficient sensitivity, satisfactory selectivity and good reproducibility. Protein precipitation method was established to obtain the good extraction recovery and no obvious matrix effect. The validated method could be applied to evaluate the pharmacokinetics and to determine bioequivalence of DAS tablets after an oral administration.